Benefits of using gdb to debug kernel
- It helps us understanding linux internals. In linux, it's very common to see structures with a lot of function pointer members being passed around. And it's not easy to find out where and how these function pointers are actually called by reading code. By setting breakpoint on the function, we can easily find how linux call into it.
- It saves the debugging time. If we only debug by printk, we usually have to compile and deploy linux kernel multiple times to fix a minor bug. It's more efficient to debug if we can step through the code and see all variables' value in real time.
Preparations
As the precedent document illustrates, to enable kgdb for a kernel, we need to:- Enable kernel config options for kgdb
- Provide a polling tty driver for the kgdboc I/O driver.
- Set linux boot argument to instruct linux kernel use our kgdb I/O driver
How to complete a kgdb I/O driver
Linux contains a kgdb I/O driver, kgdboc, short for kgdb over console. It's acutally a thin driver that relies on low level hardware driver supporting polling operation. This low level driver must be implemented by us.To complete the polling driver, we need to implement poll_get_char and poll_put_char callbacks in the UART driver. There is a good example for us to follow in linux source code: 8250.c.
How to debug if there is only one serial port
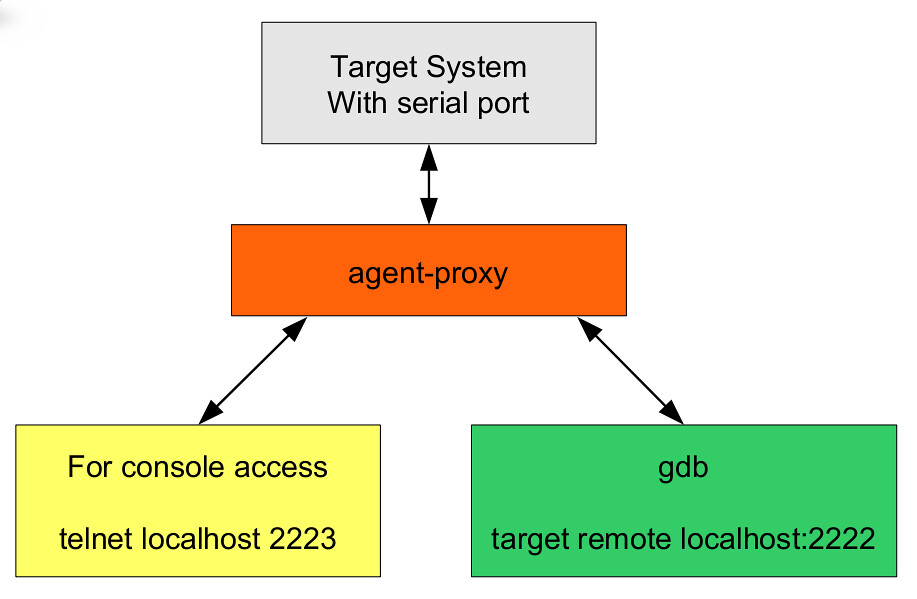
kgdboc is designed to work when there is only one serial port on our board. The serial port can be used as primary console as well as the communication channel with gdb. In this case, we should first connect our serial port client (e.g., kermit) to the console and input 'echo g > /proc/sysrq-trigger' command to break into linux kernel. Now linux should halt and wait for a gdb client to connect. Then we exit the serial port client process and start a gdb client to connect to the linux on the same serial port. It's time-division multiplexing on the serial port.The agent-proxy make the process even easier. agent-proxy is a tty to tcp connection mux that allow us connect more than one client application to a tty. By using it, we can run the serial port client and gdb process simultaneously.
How to debug linux initialization code
If we specify kgdbwait parameter in kernel boot args, the kernel will halt automatically during the initialization process and wait for a gdb client to connect. There are several things to note:- The kgdb core tries to break the execution as soon as a kgdb io driver is registered, which is done while the kgdboc module is initialized. As a result, it's necessary to set kgdboc module as built-in, rather than a module.
- Our UART driver must be initialized before the kgdboc driver. Or the kgdboc driver will fail to initialize. Becuase there isn't a reliable way to specify loading order for built-in modules at the same level, it's better to specify our UART driver at a precedent level than kgdboc, for instance, fs_initcall.
- The module initialization is called through this call stack: start_kernel -> rest_init -> kernel_init -> do_basic_setup -> do_initcalls. So, we can't debug code earlier than do_initcalls.