Thursday, April 14, 2011

extend windows ce platform with oalioctl

Though not being a open source platform, windows ce is designed to be flexible so that device venders can extend it easily. oalioctl is a feature that makes it possible to do things in kernel space on behalf of application.

Features
1. Extensibility
The essential feature of oalioctl is it enables us to extend windows ce kernel's functions, and new functions are directly accessible to application layer developers.
2. Separation
oalioctl is completely separated from kernel source code. From the sense of code organization, it doesn't differ from a normal device driver. The separation makes it easy to maintain and port oalioctl module.
3. Easy to use

Compared to a normal ce driver, the usage of oalioctl is easier from an application developer's perspective. In order to make use of a normal driver, application usually follows below sequence:
CreateFile -> DeviceIoControl -> CloseHandle
But the application can simply call KernelIoControl to make use of oalioctl library, which is a far more easy way.

Implementation
oalioctl is implemented as a standalone dynamic library. And it will be loaded automatically during kernel initialization (relevant code is in LoaderInit() function in X:\WINCE600\PRIVATE\WINCEOS\COREOS\NK\KERNEL\loader.c). So it's not necessary to register this module in platform.reg as other stream drivers do.
When an application calls KernelIoControl, the call stack goes like this:
IOControl //our own oalioctl.cpp
OEMIOControl  // platform/common/src/common/ioctl/ioctl.c
IOControl // public/common/oak/oalioctl/oalioctl.cpp
EXTKernelIoCtl // private/winceos/coreos/nk/kernel/kwin32.c

How to implement our own oalioctl
It's a fair simple task to implement oalioctl layer for our own platform with following steps:
  1. copy public/common/oak/oalioctl directory to platform/platform_name/src/drivers
  2. change TARGETTYPE to DYNLINK in sources file
  3. define our own iocontrol code with CTL_CODE macro
  4. add a case branch for the new iocontrol code

Tuesday, March 8, 2011

resolve windows ce remote tool connection issue

remote tools for windows ce is a set of powerful tools for debugging. I have Visual Studio 2005, Windows Embedded CE 6.0 R3 installed, but the remote tools don't work. They fail to connect to device with following error message:
The Microsoft ActiveSync reported the following error: Unable to load device side components. Please check server configuration settings.

There are two ways to resolve the connection issue.

1. Run remote tools from windows start menu (e.g., Microsoft Visual Studio 2005\Visual Studio Remote Tools\Remote Process Viewer, which is a shortcut to C:\Program Files\CE Remote Tools\5.01\bin\ccpview.exe), instead of starting from visual studio menu (e.g., Target/Remote Tools/Process Viewer, which is a shortcut to C:\Program Files\Common Files\Microsoft Shared\Windows CE Tools\Platman\bin\wce600\cepview.exe). remote tools version 5.01 work fine.

2. Copy
c:\Program Files\Common Files\Microsoft Shared\Windows CE Tools\Platman\target\wce600\armV4i\
to
c:\Program Files\Common Files\Microsoft Shared\Windows CE Tools\Platman\target\wce600\armV4\
. The lack of the second directory is a bug in remote tools version 6 that causes the connection issue.

Tuesday, January 25, 2011

view call stack of crashed application on android

On android, when a process crashes in native code, the call stack of the process will be saved to a log file in /data/tombstomes/, and written to logcat as well. The information is helpful for debugging.
Unfortunately, the call stack doesn't show in human readable format, file name, function name. Instead, it's shown as module name (e.g., libc.so) and memory address of the instruction. We can use addr2line to translate the address to corresponding file name and function name if we have the binary of the module that contains symbol information.
To make it easier to use, this function is included in agdb tool (see here for more). We can use "agdb.py -r -e module_name address" to find out the function name of specified address within the module.

When we have a long call stack, instead of running the command above for each line in the call stack manually, we can feed the whole call stack to agdb through pipe and get the full resolved call stack. For example, use  "adb logcat | agdb.py -r" command for adb logcat output with below contents:

22 F/ASessionDescription(   33): frameworks/base/media/libstagefright/rtsp/ASessionDescription.cpp:264 CHECK_GT( end,s) failed:  vs.
23 I/DEBUG   (   30): *** *** *** *** *** *** *** *** *** *** *** *** *** *** *** ***
24 I/DEBUG   (   30): Build fingerprint: 'generic/generic/generic:2.3.1/GINGERBREAD/eng.raymond.20101222.130550:eng/test-keys'
25 I/DEBUG   (   30): pid: 33, tid: 450  >>> /system/bin/mediaserver <<<
26 I/DEBUG   (   30): signal 11 (SIGSEGV), code 1 (SEGV_MAPERR), fault addr deadbaad
27 I/DEBUG   (   30):  r0 deadbaad  r1 0000000c  r2 00000027  r3 00000000
28 I/DEBUG   (   30):  r4 00000080  r5 afd46668  r6 40806c10  r7 00000000
29 I/DEBUG   (   30):  r8 8031db1d  r9 0000fae0  10 00100000  fp 00000001
30 I/DEBUG   (   30):  ip ffffffff  sp 40806778  lr afd19375  pc afd15ef0  cpsr 00000030
31 I/DEBUG   (   30):          #00  pc 00015ef0  /system/lib/libc.so
32 I/DEBUG   (   30):          #01  pc 00001440  /system/lib/liblog.so
33 I/DEBUG   (   30):
34 I/DEBUG   (   30): code around pc:
35 I/DEBUG   (   30): afd15ed0 68241c23 d1fb2c00 68dae027 d0042a00
36 I/DEBUG   (   30): afd15ee0 20014d18 6028447d 48174790 24802227
37 I/DEBUG   (   30): afd15ef0 f7f57002 2106eb56 ec92f7f6 0563aa01
38 I/DEBUG   (   30): afd15f00 60932100 91016051 1c112006 e818f7f6
39 I/DEBUG   (   30): afd15f10 2200a905 f7f62002 f7f5e824 2106eb42
40 I/DEBUG   (   30):
41 I/DEBUG   (   30): code around lr:
42 I/DEBUG   (   30): afd19354 b0834a0d 589c447b 26009001 686768a5
43 I/DEBUG   (   30): afd19364 220ce008 2b005eab 1c28d003 47889901
44 I/DEBUG   (   30): afd19374 35544306 d5f43f01 2c006824 b003d1ee
45 I/DEBUG   (   30): afd19384 bdf01c30 000281a8 ffffff88 1c0fb5f0
46 I/DEBUG   (   30): afd19394 43551c3d a904b087 1c16ac01 604d9004
47 I/DEBUG   (   30):
48 I/DEBUG   (   30): stack:
49 ........................
92 I/DEBUG   (   30):     408067e4  6f697470
93 I/BootReceiver(   75): Copying /data/tombstones/tombstone_09 to DropBox (SYSTEM_TOMBSTONE)

we get:


22 F/ASessionDescription(   33): frameworks/base/media/libstagefright/rtsp/ASessionDescription.cpp:264 CHECK_GT( end,s) failed:  vs.
23 I/DEBUG   (   30): *** *** *** *** *** *** *** *** *** *** *** *** *** *** *** ***
24 I/DEBUG   (   30): Build fingerprint: 'generic/generic/generic:2.3.1/GINGERBREAD/eng.raymond.20101222.130550:eng/test-keys'
25 I/DEBUG   (   30): pid: 33, tid: 450  >>> /system/bin/mediaserver <<<
26 I/DEBUG   (   30): signal 11 (SIGSEGV), code 1 (SEGV_MAPERR), fault addr deadbaad
27 I/DEBUG   (   30):  r0 deadbaad  r1 0000000c  r2 00000027  r3 00000000
28 I/DEBUG   (   30):  r4 00000080  r5 afd46668  r6 40806c10  r7 00000000
29 I/DEBUG   (   30):  r8 8031db1d  r9 0000fae0  10 00100000  fp 00000001
30 I/DEBUG   (   30):  ip ffffffff  sp 40806778  lr afd19375  pc afd15ef0  cpsr 00000030
31 I/DEBUG   (   30):          #00  pc 00015ef0  /system/lib/libc.so
32 I/DEBUG   (   30):          #00  __libc_android_abort: abort.c:82
33 I/DEBUG   (   30):          #01  pc 00001440  /system/lib/liblog.so
34 I/DEBUG   (   30):          #01  __android_log_assert: logd_write.c:235
35 I/DEBUG   (   30):
36 I/DEBUG   (   30): code around pc:
37 I/DEBUG   (   30): afd15ed0 68241c23 d1fb2c00 68dae027 d0042a00
38 I/DEBUG   (   30): afd15ee0 20014d18 6028447d 48174790 24802227
39 I/DEBUG   (   30): afd15ef0 f7f57002 2106eb56 ec92f7f6 0563aa01

Similarly, we copy a tombstone file to our development pc, and use "cat tombstone_01.txt | agdb.py -r" command to resolve call stack addresses in the tombstone log file.

Wednesday, January 19, 2011

install h.264 plugin for linphone on ubuntu

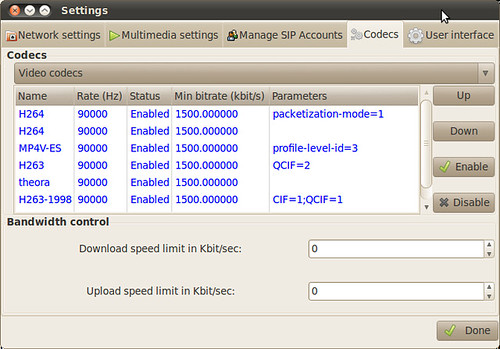
h.264 plugin isn't a standard part of linphone installation on ubuntu. We must manually compile and install it.

1. Download msx264 plugin source code.
2. Run sudo apt-get install libmediastreamer-dev libx264-dev libavcodec-dev libswscale-dev libtheora-dev to meet msx264's dependency requirements.
3. Run ./configure --prefix=/usr/lib. It's mandatory to set prefix to /usr/lib, because linphone can't find the plugin if it's installed in default location, /usr/local/lib.
4. Run sudo make install.
5. Change the line 393 in src/msx264.c from


393     if (sws_scale(s->sws_ctx,(uint8_t * const*)orig->data,orig->linesize, 0,

to


393     if (sws_scale(s->sws_ctx,(uint8_t **)orig->data,orig->linesize, 0,

to get rid of compilation error, if you have.

6. Restart linphone, the h.264 plugin should be available now.

Thursday, January 13, 2011

utility for debugging android native application

agdb is a utility aims to ease the task of debugging android native application. Its working mechanism is similar to ndk-gdb. But it's intended to assist debugging native applications in android source tree, not for application created with ndk.

It does following things for us automatically:
  1. find the binary that contains symbol data of target process
  2. attach gdbserver to the target process on device, or start the target process under gdbserver if the process isn't already running
  3. start gdb client and set correct symbol file search path
How to use it
  prerequirements
agdb must know the root directory of android source code. We can tell it by passing --android-src-root argument or setting ANDROID_SRC_ROOT environment variable.
agdb interacts with target device through adb, so the device must be accessible through adb.
gdb client communicates gdbserver through tcp protocol (tcp port 7890 by default). If using emulator, we need to forward or redir tcp ports in advance.

 usage
After all prequirements are met, we can run "agdb.py process_name" to debug desired application. For example, if we want to debug mediaserver application, simply run agdb.py mediaserver.
If we want to debug code in native part of a dalvik (java) application, we can use:
agdb.py --dalvik [package_name (for example, com.android.launcher)]


Limitation
It doesn't work on Windows.
It starts gdbserver in network communication mode, serial port isn't supported.
It doesn't support dalvik application.

Reference
http://source.android.com/porting/debugging_gdb.html

Monday, January 10, 2011

view raw yuv file with mplayer

mplayer is a powerful utility that is helpful for examining the raw yuv file.
We decoded this h.264 media file (test_avc_amr.mp4) coming with android opencore to yuv format, saved as a.yuv. The command below can display the yuv file frame by frame:
mplayer -demuxer rawvideo -rawvideo w=176:h=144:format=i420 a.yuv -loop 0

The internal structure of a.yuv is a serial of yuv frames, without any header describing the size and format.

So, to make mplayer work, we should tell it the width and height of the yuv in pixel. Also, we need to specify the format of the raw video. The command below shows us all available formats:
mplayer -rawvideo format=help

References:
mplayer manual page
mplayer online documentation

Friday, December 24, 2010

another free uml tool, bouml

Having tried metauml as my primary design utility recently, the experience isn't as good as I expected. At the beginning, I thought I would be more focused on the content/design while using a pure textual editing tool, but the result is very frustrating. Because I have to pay more attention on the organization and layout, rather than the design. metauml doesn't help me organizing elements at all, leave it all to me. I have to think in advance where should an element be placed, and instructed metauml to place the element explicitly, either in absolute coordinate or in relative coordinate. It seems ok for simple diagrams with very few elements. But as the number of elements increases, it's very hard to plan in advance. Once I made a mistake, the cost to change it is huge, I may have to re-organize everything, to keep the diagram clean.
I found an graphical tool, bouml, as an great replacement. It's efficient and powerful. bouml saves everything in text, so it's also possible to do version control. The best feature I noticed so far is its capability of reversing c++ code. By  feeding it with source code directories, it will generate a full list of classes, methods exist in the code. It's very helpful for analyzing others' projects.

Tuesday, December 21, 2010

common programming and debugging tools

To help me memorize commonly used programming and debugging tools on windows and linux, I created a wiki page here:
http://code.google.com/p/rxwen-blog-stuff/wiki/CommonProgrammingAndDebuggingToolsOnWinAndLinux

Sunday, December 19, 2010

port exosip to android

Port exosip to android platform isn't a difficult task because exosip doesn't rely on any special system calls that aren't available on android. It only requires osip to compile, which can also be easily ported.
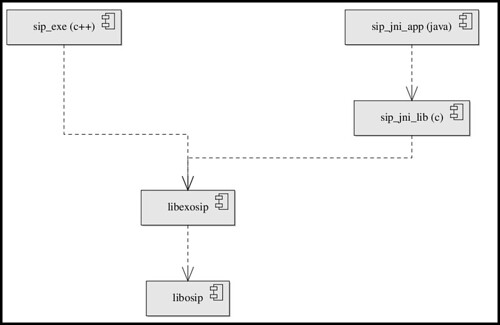
As an example, I created two applications to run against exosip lib. One is a native application that can run in android shell, the other is an java application that interact with exosip through jni. The dependency relationship between modules is:

The diagram below depicts the organization of files. They're organized this way so that they can be compiled through android ndk build system.
exosip_root (NDK_MODULE_PATH environment variable points here)
To comply with ndk build system's requirements, we create a directory named jni under sip_jni and sip_exe module, and place actual source file there. The Android.mk and Application.mk (optional) are placed in the jni directory as well. Keeping files this way, we can issue ndk-build command right in sip_jni or sip_exe directories to compile applications.
Note that we don't create jni directory for libosip and libexosip, their Android.mk is placed directly under libosip and libexosip directories. This is because they are dependent on by application modules. We don't need compile them directly, instead, the build system will build them automatically while building applications. In order to help build system find libosip and libexosip, we must set NDK_MODULE_PATH environment variable to the directory that directly containing  libosip and libexosip. The build system will search for them based on directory name, so their names matter.

To port exosip to android, the essential task is to create the Android.mk file, which specifies source files, c flags, ld flags, dependent libraries. We define HAVE_TIME_H and HAVE_SYS_SELECT_H to compile exosip successfully. And we define ENABLE_TRACE and OSIP_MT to enable logging and multi-threading. In the last line, $(call import-module,libosip) tells the build system that exosip depends on osip, and all header files exported by osip (LOCAL_EXPORT_C_INCLUDES:=$(LOCAL_C_INCLUDES))  will be included by exosip automatically. 
import-module is a feature that isn't available in the build system in android source tree. It enables us organizing our projects in arbitrary manner. For example, we can place libosip and libexosip directories in another directory. The build system can still find them as long as NDK_MODULE_PATH is set to the directory containing them. It's much more flexible than specifying dependency relationship with relative path.

Sample:
The sample for this post is available at:
http://code.google.com/p/rxwen-blog-stuff/source/browse/trunk/android/exosip_sample/
It shows how to:
  1. use ndk build system
  2. use stl in c++ code
  3. create a very basic exosip application
  4. call native code from java
  5. call java code from native code
References:
ndk document
exosip user manual

Tuesday, December 14, 2010

tools for working with android jni

When we make use of jni on android, it's a error-prone task to manually write the native function name for a given java native function. Though there are rules for us to follow, no one would like to memorize that. javah to the rescue.
For example, for the following java class with a native method.
 1 package com.rmd.jni;

 2

 3 import android.app.Activity;

 4 import android.os.Bundle;

 5

 6 public class Main extends Activity

 7 {

 8     /** Called when the activity is first created. */

 9     @Override

10     public void onCreate(Bundle savedInstanceState)

11     {

12         super.onCreate(savedInstanceState);

13         setContentView(R.layout.main);

14     }

15

16     public native boolean JniMethod(int a);

17 }


We can follow steps below to generate a native header file:
  1. cd to project root folder
  2. Compile the project, e.g., using ant debug command
  3. run javah -jni -classpath bin/classes -d jni com.rmd.jni.Main (this command generates a native header file in jni directory, for com.rmd.jni.Main class)

And we get a header file com_rmd_jni_Main.h with content below:

 1 /* DO NOT EDIT THIS FILE - it is machine generated */

 2 #include <jni.h>

 3 /* Header for class com_rmd_jni_Main */

 4

 5 #ifndef _Included_com_rmd_jni_Main

 6 #define _Included_com_rmd_jni_Main

 7 #ifdef __cplusplus

 8 extern "C" {

 9 #endif

10 /*

11  * Class:     com_rmd_jni_Main

12  * Method:    JniMethod

13  * Signature: (I)Z

14  */

15 JNIEXPORT jboolean JNICALL Java_com_rmd_jni_Main_JniMethod

16   (JNIEnv *, jobject, jint);

17

18 #ifdef __cplusplus

19 }

20 #endif

21 #endif


There are cases that we need to provide a method signature of a java function to the GetMethodID function in native code. javap can help us.
Consider the java class below, within which exists a JniCallback method. And this method is meant to be called from native code.

 1 package com.rmd.jni;

 2

 3 import android.app.Activity;

 4 import android.os.Bundle;

 5

 6 public class Main extends Activity

 7 {

 8     /** Called when the activity is first created. */

 9     @Override

10     public void onCreate(Bundle savedInstanceState)

11     {

12         super.onCreate(savedInstanceState);

13         setContentView(R.layout.main);

14     }

15

16     public boolean JniCallback(int a);

17 }

After it's compiled, we can use javap -classpath bin/classes -s -p com.rmd.jni.Main command to find out the signature of JniCallback method. Shown below.
Compiled from "Main.java"
public class com.rmd.jni.Main extends android.app.Activity{
public com.rmd.jni.Main();
Signature: ()V
public void onCreate(android.os.Bundle);
Signature: (Landroid/os/Bundle;)V
public native boolean JniMethod(int);
Signature: (I)Z
}

Reference:
Java Native Interface Programming

Wednesday, December 8, 2010

learning opencore through unit testing

Android 2.3 gingerbread was officially released. A big improvement is this version is in media framework, as stated in platform highlights:

Media Framework

  • New media framework fully replaces OpenCore, maintaining all previous codec/container support for encoding and decoding.
  • Integrated support for the VP8 open video compression format and the WebM open container format
  • Adds AAC encoding and AMR wideband encoding

I'm not able to find out what is the replacement for opencore yet. But before opencore is obsoleted, I still would like to share my way of learning opencore. This might be helpful for those who still have to work on legacy android platforms.

Opencore is a complicated multimedia framework. An effective way I thought a bit easier to learn it is looking at its unit testing code and debugging unit testing application. The advantages include:
  1. The code can be compiled as x86 executable, so we can run it on our pc directly, rather than on a android device or emulator.
  2. The application can be debugged with gdb 
  3. Unit tests demonstrate the simplest usage of opencore. It's particularly useful for a fresh learner to get started.
  4. Test cases each have its own concentration, and is easier to follow.
So, if we use unit testing code as a means of learning opencore, instead of trying to understand the full-featured mediaserver, things will be much easier. We can find out the simplest way to initialize opencore and play a file. For any specific requirement we need to implement, we can always find a corresponding test case in the unit test guide and refer to its source code.

How to debug opencore with gdb
Before we use gdb to debug unit testing application, we need to be aware of a helpful gdb feature: show real type of a object though pointer.
In opencore framework, it always manipulate a concrete object through an interface or base pointer. So, during debugging, we often get lost about what the actual type of the object being pointed to by the pointer is. Gdb can print the real type of object if the pointer points to it has virtual table. This feature can be turned on with "set print object" command. 
For example, if we break at the line returns a pointer in PVPlayerNodeRegistry::CreateNode function, we issue "p nodeInterface" command without print object turning on, we see:
$1 = (class PVMFNodeInterface *) 0x83c65c0
The type of the pinter is shown as PVMFNodeInterface, which isn't very informative because is the base type. If we trun print object on and run the command again, we see:
$2 = (PVMFMP4FFParserNode *) 0x83c65c0
The real type of the object is clearly printed. Very useful feature for debugging complex frameworks.
We can follow below steps to compile and debug unit testing application:
  1. Compile the app by following instructions in quick_start.txt
  2. cd to {open_core_root}/build_config/opencore_dynamic/build/pe_test. We need to start debugging here, otherwise the application may fail to find necessary libraries and media files.
  3. export LD_LIBRARY_PATH=../installed_lib/linux
  4. gdb ../bin/linux/pvplayer_engine_test
  5. set desired breakpoints
  6. run -source test.mp4 -test 1 1. The source and test case number argument can be changed accordingly.

Sunday, December 5, 2010

python decorators

Decorator is a very expressive language feature in python. It helps developers to write cleaner, modular code that is easier to extend and maintain. It also helps implement AOP and decorator pattern in python.

Decorator syntax
To declare a decorator function, we can define a function that takes a another function as argument and returns a function. The usage of decorator is very simple, just add a line begins with '@' symbol and the name of the decorator before the function to be decorated.

 1 def decorator(func):
 2     def new_func():
 3         print "decorator message"
 4         func()
 5     return new_func
 6
 7 @decorator
 8 def foo():
 9     print "hello world"
10
11 foo()

The effect is when we call foo function, besides print "hello world" message, the message "decorator message" is also printed. That is, the decorator function extends foo function's behavior.
The code above is equivalent to:
 

 1 def decorator(func):
 2     def new_func():
 3         print "decorator message"
 4         func()
 5     return new_func
 6
 7 def foo():
 8     print "hello world"
 9
10 foo = decorator(foo)
11 foo()

Decorators can also accept arguments, as long as it returns a decorator function that takes a function as argument.
 1 def decorator_with_arg(arg):
 2     def decorator(func):
 3         def new_func():
 4             print arg
 5             func()
 6         return new_func
 7     return decorator
 8
 9 @decorator_with_arg("arg for decorator")
10 def foo():
11     print "hello world"
12
13 foo()


The example above is equivalent to :

 1 def decorator_with_arg(arg):
 2     def decorator(func):
 3         def new_func():
 4             print arg
 5             func()
 6         return new_func
 7     return decorator
 8
 9 def foo():
10     print "hello world"
11
12 foo = decorator_with_arg("arg for decorator")(foo)
13 foo()
The decorator_with_arg function creates a closure, so that the arg argument can still be used after the decorator_with_arg returned. Since it's possible for a decorator to accept arguments, the decorator's behavior can changed based on the argument passed in. So it's possible to write more flexible code.

A more practical example
Here is a more practical example. We create a tracable decorator which is a debugging utility. It will keep records of the number of times that a function decorated with it is invoked.
 1 trace_log = {}
 2
 3 def tracable(func):
 4     def decorated_func(*arg, **kwarg):
 5         if not trace_log.has_key(func.__name__):
 6             trace_log[func.__name__] = 1
 7         else:
 8             trace_log[func.__name__] += 1
 9         func(*arg, **kwarg)
10
11     return decorated_func
12
13 def print_trace_log():
14     for key, value in trace_log.items():
15         print "%s called %d times"%(key, value)
16
17 @tracable
18 def foo1():
19     print "foo1"
20
21 @tracable
22 def foo2(arg, kwd="keyword arg"):
23     print "foo2"
24     print arg
25     print kwd
26
27 @tracable
28 def foo3():
29     print "foo3"
30
31 foo1()
32 foo1()
33 foo1()
34 foo2(12)
35 foo2(13)
36
37 print_trace_log()

If we run the code, it will prints that foo1 function is called three times and foo2 function is called twice.
As the example showed, the code for implementing tracing is separated from business logic code contained within foo1 and foo2. The maintainability of the program is much higher than if the code for tracing is mixed with business logic code.

Summary
We got several benefits from decorator.
First, it helps achieve a better separation of business logic code and auxiliary code.
Second, it helps finding out where the auxiliary is used because decorator employs a very special syntax.
Third, we can extend or change our business logic without having to change existing code. New code can be implemented as a decorator.


References:
Charming Python: Decorators make magic easy
Decorators for Functions and Methods
PythonDecorators