Question:
Write an O(n)-time nonrecursive procedure that, given an n-node binary tree, prints out the key of each node in the tree. Use a stack as an auxiliary data structure.
Answer:
This isn't a difficult question. But the skill of turning a recursive algorithm to non-recursive algorithm is so important, it worths a blog post.
The data structure for tree node used in this post is defined as:
class TreeNode
{
public:
int value;
TreeNode* left; // left child node
TreeNode* right; // right child node
}
The simplest and cleanest algorithm for binary tree traversal is the recursion. As shown below:
void inOrderTraversalRecursive(TreeNode* node)
{
if(Null == node)
return;
inOrderTraversalRecursive(node->left); // visit left sub-tree first
visit(node); // visit current node
inOrderTraversalRecursive(node->right); // visit right sub-tree
}
In this algorithm, each time we goes down a level to the calling stack, a new stack frame will be created for the new function call. Then the context changes to the new stack frame. And the node is kept on the previous stack frame. In current stack frame, node is the left or right child of last stack frame's node. With the help of stack, after a function call is finished, the context changes back to the previous stack frame and consequently gets back to the parent node. Because this stack is managed automatically be the compiler, this algorithm becomes so simple. But this stack isn't unlimited, if the tree's height is large enough, the stack may exhaust. In order to get over this limit, we can use a heap (whose limit is far larger.) based stack data structure and manage it ourselves.
This is done in a loop. Each iteration of the loop is regarded as a function call in recursive version. At proper point of the iteration, we must push/pop node from/to stack so that the context of the iteration can be maintained.
In recursive version, if node is not null, we need to save current node in stack (push) and change node to node->left. Otherwise, the function call returns right away, which means the node is restored (pop) to the value in last call stack frame. After the left sub-tree has been visited, we visit current node.
Then we save (push) current node again and change node to node->right to visit right sub-tree. After it's done, we need to restore (pop) node. But as we can see in the recursive version, the node isn't used at all after the right sub-tree has been visited. That's to say, it's not necessary to save context before we visit right sub-tree any more. This procedure can be omitted in this case.
The last thing to determine is the termination condition. In what situation can we terminate the loop? First, it's clear that the stack should be empty when the loop terminates. But this isn't enough, the node should be null as well to terminate the loop.
void inOrderTraversalStack(TreeNode* root)
{
typedef std::stack<TreeNode*> TreeStack;
TreeStack stack;
TreeNode *node = root;
while(NULL != node || !stack.empty())
{
if(NULL != node)
{
stack.push(node);
node = node->left;
}
else
{
node = stack.top();
stack.pop();
visit(node);
node = node->right;
}
}
}
Thursday, December 24, 2009
Thursday, December 17, 2009
Ex 9.3-8 of Introduction to algorithms
Question:
Let X[1 .. n] and Y [1 .. n] be two arrays, each containing n numbers already in sorted order. Give an O(lg n)-time algorithm to find the median of all 2n elements in arrays X and Y.
Answer:
Without losing generality, suppose the median z is the smaller median (there are two medians since total number is even), it's the ith element in array X. In array X, there are i-1 numbers smaller than z and n-i numbers larger than the z. Because z is the median of all 2n elements, there should be n-i numbers in Y smaller than z and i numbers larger than z.
In order to find out z, we first compare the median of X and Y. Say they are mx and my respectively. If mx is smaller than my, we compare mx and the largest element in Y that is smaller than my, say it's my2. If mx is larger than my2, then mx is z, the median of all 2n elements. Otherwise, z must be in higher half of X or lower half of Y. So, we can perform preceding logic recursively.
This algorithm works just like binary search tree whose running time is O(lg n).
The code for the algorithm is available at:
http://code.google.com/p/rxwen-blog-stuff/source/browse/trunk/algorithm/i2a_ex_9.3-8/ex9_3_8.cpp
Friday, December 11, 2009
use memcmp to compare objects?
I came across a question regarding c++, is it more efficient to use memcmp to determine equality of two objects of the same type.
This is not a question regarding efficiency at all, it's about correctness. Using memcmp to compare two objects MAY be correct sometimes, but it really depends on several factors:
We know many compiler will align a class's members to word size for better performance, because it's harder to read or write memories at arbitrary location. So possibly, there are gaps (unused memories) between fields.
Those gaps are occupied by objects of the class, but are note directly managed through objects. The contents of these gaps are undefined. They may be what's left over since their last usage. Or they might be cleared/filled by a diligent compiler.
When you use memcmp to compare two objects, these gaps which has random bits are also taken into considertion. But this is undesired behavior and leads to uncertainty.
So, never do this unless you're 100% sure about the memory layout, compiler behavior, and you really don't care portability, and you really want to gain the efficiency.
The demo below shall show using memcmp doesn't work correctly with microsoft's c++ compiler v15.00.30729.01 and gcc v4.4.1.
This is not a question regarding efficiency at all, it's about correctness. Using memcmp to compare two objects MAY be correct sometimes, but it really depends on several factors:
- Class alignment
- Compiler implementation
- Compiler configuration
We know many compiler will align a class's members to word size for better performance, because it's harder to read or write memories at arbitrary location. So possibly, there are gaps (unused memories) between fields.
Those gaps are occupied by objects of the class, but are note directly managed through objects. The contents of these gaps are undefined. They may be what's left over since their last usage. Or they might be cleared/filled by a diligent compiler.
When you use memcmp to compare two objects, these gaps which has random bits are also taken into considertion. But this is undesired behavior and leads to uncertainty.
So, never do this unless you're 100% sure about the memory layout, compiler behavior, and you really don't care portability, and you really want to gain the efficiency.
The demo below shall show using memcmp doesn't work correctly with microsoft's c++ compiler v15.00.30729.01 and gcc v4.4.1.
#include "string.h"
// ==================================
//        Class:  Foo
//  Description:
// ==================================
class Foo
{
  public:
      Foo (): a(0), b(0), c(0){
      };   // constructor
      int a;
      char b;
      int c;

}; // -----  end of class Foo  -----

void shuffle_stack()
{
  Foo f1;
  Foo f2;

  *((int*)(&f1.b)) = 0x87654321;
  *((int*)(&f2.b)) = 0x12345678;
}

int compare()
{
  Foo f1;
  Foo f2;

  return memcmp((void*)(&f1), (void*)(&f2), sizeof(Foo));
}

int main ( int argc, char *argv[] )
{
  int rc = 0;
  shuffle_stack();
  rc = compare();
  return 0;
} // ----------  end of function main  ----------
Wednesday, December 9, 2009
communicate with service on android
While doing android programming, it's a common sense to use Activity to interact with users and use Service to perform time consuming tasks (actually, such tasks are usually performed on a new thread spawned by the service). A classic example is media player. It's composed of several Activities and a playing-back Service. Through Activities, users can pick a media file to play, or control (start, pause, fast forward, set volume, etc) the playing-back Service. And the Service is responsible for playing the media file. The service can run in background even no Activity of the player application is active. It's also possible that the Service is implemented and hosted in another application other than the one where Activities are implemented.
In order to allow Activities to control the behavior of the Service, there should be an mechanism to allow they talk to each other. And by following the Process Agnostic feature of Android platform, this communication mechanism should also be able to handle Inter-Process and Inside-Process communication consistently. Such that from the upper layer application code's point of view, it's making communications between components independent of which process these components run in.
Luckily, Android has already provided such a RPC mechanism which has been briefly introduced here: Android application fundamentails - remote procedure calls. And the document Designing a Remote Interface Using AIDL also shows a tutorial about how to perform RPC.
But the documents above don't include a complete yet simple example for us to follow, so I'd like to explore how to do Inside-Process as well as Inter-Process with an example.
This example is composed of two applications. The first application (app1) will bind to a service runs in another application (app2) when a button is clicked, thus demonstrates Inter-Process communication. app2 can bind to the service too, which demonstrates Inside-Process communication.
There are two buttons on each application's Activity. First, you need to click button titled start svc to bind to service and get a reference to Binder object. Then, you can click button titled call rpc to invoke a method in service.
It's trivial to repeat the tutorial of designing remote interface. So I'd like to just post some findings during my exploration.
Source Code
browse code here:
http://code.google.com/p/rxwen-blog-stuff/source/browse/#svn/trunk/android/rpc-with-service
or via command:
svn co https://rxwen-blog-stuff.googlecode.com/svn/trunk/android/rpc-with-service
In order to allow Activities to control the behavior of the Service, there should be an mechanism to allow they talk to each other. And by following the Process Agnostic feature of Android platform, this communication mechanism should also be able to handle Inter-Process and Inside-Process communication consistently. Such that from the upper layer application code's point of view, it's making communications between components independent of which process these components run in.
Luckily, Android has already provided such a RPC mechanism which has been briefly introduced here: Android application fundamentails - remote procedure calls. And the document Designing a Remote Interface Using AIDL also shows a tutorial about how to perform RPC.
But the documents above don't include a complete yet simple example for us to follow, so I'd like to explore how to do Inside-Process as well as Inter-Process with an example.
This example is composed of two applications. The first application (app1) will bind to a service runs in another application (app2) when a button is clicked, thus demonstrates Inter-Process communication. app2 can bind to the service too, which demonstrates Inside-Process communication.
There are two buttons on each application's Activity. First, you need to click button titled start svc to bind to service and get a reference to Binder object. Then, you can click button titled call rpc to invoke a method in service.
It's trivial to repeat the tutorial of designing remote interface. So I'd like to just post some findings during my exploration.
- The onBind method of service should return a non-null IBinder. Otherwise, the callback function onServiceConnected won't be fired.
- Add two aidl interface with the same name to both projects (ISvcController.aidl in our example). And the interface can be used in both projects to manipulate the IBinder object returned by the service. These two interfaces can have different member functions, but any function to be used must have the same signature and be placed at the same place (index) in these interfaces.
- When access the service in the same process, the original IBinder returned in onBind method is passed to onServiceConnected callback method. When access the service in a different process, a proxy for the IBinder is passed to onServiceConnected callback method.
- It's necessary to call unbindService to avoid connection leaking. This can be done upon specific event handler such as a button click. A better choice is to unbind in one of Activity's life cycle events, for example, onStop. So that the connection will be freed no matter in which way the user leaves the Activity.
Source Code
browse code here:
http://code.google.com/p/
or via command:
svn co https://rxwen-blog-stuff.googlecode.com/svn/trunk/android/rpc-with-service
Monday, December 7, 2009
windows side by side assemblies
There are times when I deployed an application on a box different from the developing box, the application failed to start with following message:
"This application has failed to start because the application configuration is incorrect. Reinstalling the application may fix this problem."
And run the application in windbg also ends in no avail. It simply complained error 14001 without hitting the ntdll!DbgBreakPoint. There should be something wrong with windows loading the application. After we manually copied msvcp90.dll and msvcr90.dll to the installation folder, it still failed.
Actually, the recommended way to solve this is provided in this msdn document. But to better understand this, we need to know what's side by side assemblies on windows. Simply put, side by side assemblies is invented to get rid of dll hell.
Traditionally, windows searches for dependent dlls in application's current directory and several predefined centric locations (e.g. c:\windows\system32) by dll name. If there are several applications use different versions of a library which is planed to be stored in centric location, there comes conflicts. This can be solved by placing dependent dll in the application's folder, but it also has disadvantages. For example, if an application depends on msvcr80.dll and make a copy of this dll in the application's installation folder. Later, microsoft releases a updated version for this dll with critical bug fixing. It would be difficult to apply this update to the application. The main idea of side by side assemblies is to allow different version of the same dll to coexist in centric location that is easier to manage.
On windows, side by side assemblies are stored in c:\windows\winsxs folder. Every assembly installed there has a folder whose name is composed of the dll name and a hash value, a manifest file and policy file(redirects application from using specified version assembly to another version) in manifest, policy folder respectively. Because different version should at least have different hash value, they don't conflict with each other.
Since windows xp or later, the application loader will take care of finding the correct dll to load. If an application enables side-by-side assemblies, the application loader will load the correct version as being specified by the application in manifest file.
Applications take advantage of side by side assemblies need to have a manifest file specifying dlls it depends on (Actually, windows doesn't allow you dynamically link against crt without manifest file). The manifest file can be embedded in the binary as resource or placed in the application local folder separately. For the latter case, the manifest file's naming convention is Executable_File_Name_With_Extension.manifest. Note that if a separate manifest file exists with a binary having embedded embedded manifest, which one takes precedence is windows version specific and may be different.
To diagnose such issue, here are some tools:
1. System event viewer
The system logs information about the assembly that it fails to locate in System Event. We can use it to find out what is missing.
2. Dependency Walker
It's the best tool for identifying if dependent dlls of an application is available on the system or not.
3. FileAlyzer Utility
It can extract and categorize information from PE file, including embedded manifest file.
4. sxstrace
sxs debugging utility. But only available on vista or later version windows.
References:
How to Debug 'The System cannot Execute the specified program' message
MSDN About Isolated Application and Side by Side Assemblies
Windows Side-by-Side Assemblies (WinSxS)
"This application has failed to start because the application configuration is incorrect. Reinstalling the application may fix this problem."
And run the application in windbg also ends in no avail. It simply complained error 14001 without hitting the ntdll!DbgBreakPoint. There should be something wrong with windows loading the application. After we manually copied msvcp90.dll and msvcr90.dll to the installation folder, it still failed.
Actually, the recommended way to solve this is provided in this msdn document. But to better understand this, we need to know what's side by side assemblies on windows. Simply put, side by side assemblies is invented to get rid of dll hell.
Traditionally, windows searches for dependent dlls in application's current directory and several predefined centric locations (e.g. c:\windows\system32) by dll name. If there are several applications use different versions of a library which is planed to be stored in centric location, there comes conflicts. This can be solved by placing dependent dll in the application's folder, but it also has disadvantages. For example, if an application depends on msvcr80.dll and make a copy of this dll in the application's installation folder. Later, microsoft releases a updated version for this dll with critical bug fixing. It would be difficult to apply this update to the application. The main idea of side by side assemblies is to allow different version of the same dll to coexist in centric location that is easier to manage.
On windows, side by side assemblies are stored in c:\windows\winsxs folder. Every assembly installed there has a folder whose name is composed of the dll name and a hash value, a manifest file and policy file(redirects application from using specified version assembly to another version) in manifest, policy folder respectively. Because different version should at least have different hash value, they don't conflict with each other.
Since windows xp or later, the application loader will take care of finding the correct dll to load. If an application enables side-by-side assemblies, the application loader will load the correct version as being specified by the application in manifest file.
Applications take advantage of side by side assemblies need to have a manifest file specifying dlls it depends on (Actually, windows doesn't allow you dynamically link against crt without manifest file). The manifest file can be embedded in the binary as resource or placed in the application local folder separately. For the latter case, the manifest file's naming convention is Executable_File_Name_With_
To diagnose such issue, here are some tools:
1. System event viewer
The system logs information about the assembly that it fails to locate in System Event. We can use it to find out what is missing.
2. Dependency Walker
It's the best tool for identifying if dependent dlls of an application is available on the system or not.
3. FileAlyzer Utility
It can extract and categorize information from PE file, including embedded manifest file.
4. sxstrace
sxs debugging utility. But only available on vista or later version windows.
References:
How to Debug 'The System cannot Execute the specified program' message
MSDN About Isolated Application and Side by Side Assemblies
Windows Side-by-Side Assemblies (WinSxS)
Friday, December 4, 2009
Ex5.1-3 of Introduction to Algorithms
Question:
Suppose that you want to output 0 with probability 1/2 and 1 with probability 1/2. At your disposal is a procedure BIASED-RANDOM, that outputs either 0 or 1. It outputs 1 with some probability p and 0 with probability 1 - p, where 0 < p < 1, but you do not know what p is. Give an algorithm that uses BIASED-RANDOM as a subroutine, and returns an unbiased answer, returning 0 with probability 1/2 and 1 with probability 1/2. What is the expected running time of your algorithm as a function of p?
Answer:
If we run BIASED-RANDOM twice, we might get of of following result: 00, 01, 10, 11. And the probabilities for getting each of them is: (1-p) square, (1-p)*p, p*(1-p), p square respectively. We can see that the probabilities for getting 01 equals 10. So, if we can constraint the output to either 01 or 10, we have a UNBIASED-RANDOM that can return 01 or 10 with probability of 1/2 each. And we can simply replace 01, 10 with 0 and 1 to get desired function. How can we constraint the result in 01 and 10? We can use the similar idea used in Ex5.1-2, that's abandoning any result that doesn't belong to 01 and 10 till we get one of them.
And there's a risk in this algorithm. If p is very close to 1 or 0, we may need to try a looooot of times to get either 01 or 10 which makes a very poor performance. To get around this, we can invoke BIASED-RANDOM more times. As we know, the probability of getting a full 0 or 1 permutation is p power the number of times invoking BIASED-RANDOM. And because p is between 0 and 1, the more we invoke BIASED-RANDOM, the less will the probability be, consequently the quicker we don't get full 0 or 1.
Code:
#include "iostream"
#include "ctime"
using namespace std;
int p = 50;

int BIASED_RANDOM ()
{
  int rc = 0;
  if((rand() % 100) >= p)
      rc = 1;
  else
      rc = 0;
  return rc;
}  // -----  end of function BIASED_RANDOM  -----

int UNBIASED_RANDOM()
{
  int rc = 0;

  int temp = 0;
  int i = 0;
  while(true)
  {
      temp = 0;
      temp = BIASED_RANDOM() * 10 + BIASED_RANDOM();
      if(temp == 10 || temp == 1)
          break;
  }

  if(temp == 10)
      rc = 1;
  else
      rc = 0;
  return rc;
}

int main ( int argc, char *argv[] )
{
  if(argc > 1)
      p = atoi(argv[1]);
  srand(time(NULL));

  int rc = 0;
  for(int i = 0; i < 100; ++i)
      rc += BIASED_RANDOM();
  cout << "BIASED SUM:" << rc << endl;
  rc = 0;
  for(int i = 0; i < 100; ++i)
      rc += UNBIASED_RANDOM();
  cout << "UNBIASED SUM:" << rc << endl;
  return 0;
}    // ----------  end of function main  ----------
main thread in android application
In android sdk document, it's mentioned that all components(Activity, Service, etc) run on the main thread. The main thread is the thread where our code works on.
Conventionally, when talk about a Service, we think it this way:
void service()
{
while(isRunning)
{
// do something
}
}
In other words, a service is usually implemented as a infinite loop. If this is the case for android service, how can it run with other components on the same thread simultaneously?
And think about activity. It has to listen for incoming events like clicking a button, which also implies the pattern of an infinite loop. So, it's also not possible for activity to coexist with other components in the same thread as well.
In fact, components don't have their own loop, instead, they share the same main loop which is implemented in Looper. This also explains why google strongly recommends not do any long-running tasks in a component's life cycle events. Say, if we run a procedure for a long time in onBind function of a service, the main thread won't have any chance to deal with new message in the loop until the procedure finishes. The best idea is to spawn a new thread to do the task and let the main thread back to the main loop as soon as possible.
Looper is the starting point of an application. It acts as the role of message loop. It loops forever waiting for incoming messages and dispatch messages to corresponding components to handle. Upon receiving a message, the corresponding handler object's dispatchMethod will be invoked.
So, in android, a component is a object with a state machine and is able to handle all kinds of messages.
Wednesday, December 2, 2009
Ex5.1-2 of introduction to algorithms
A friend asked my idea about the exercise 5.1-2 of introduction to algorithms. Here is the original question:
Question:
Describe an implementation of the procedure RANDOM(a, b) that only makes calls to RANDOM(0, 1). What is the expected running time of your procedure, as a function of a and b? ( RANDOM(0,1) returns either 0 or 1 with the same probability, and RANDOM(a,b) is supposed to return any number between [a,b] with the same probability.)
First Answer: [wrong]
My initial answer which is obviously wrong is like this:
Second Answer:
The question is similar to flip coins. Each time we flip a coin, we have the same probability to get either 0 or 1. If we flip the coin for several times, the probability of getting each permutation of 0 and 1 is the same. So, if we can use each permutation to represent a distinct number between a and b, we shall get the desired RANDOM function.
How to represent a number with a serials of 0 and 1s? Binary format!
So, if we run the RANDOM(0,1) for 1+lg(b-a) times and convert the final permutation to a decimal value plus a, that's the value we want. And we need to be careful since b-a might not be exact power of 2, so we need to run RANDOM(0,1) for ceiling of 1+lg(b-a) times. But a serial of 0 and 1 of this length might represent a number exceeds b-a, we can abandon the value and restart RANDOM(a,b) till the number is smaller than b-a.
And the code is:
Question:
Describe an implementation of the procedure RANDOM(a, b) that only makes calls to RANDOM(0, 1). What is the expected running time of your procedure, as a function of a and b? ( RANDOM(0,1) returns either 0 or 1 with the same probability, and RANDOM(a,b) is supposed to return any number between [a,b] with the same probability.)
First Answer: [wrong]
My initial answer which is obviously wrong is like this:
But thinking it more carefully, it doesn't return every number at the same probability.
RANDOM(int a, int b)
{
int rc = a;
for(int i = 0; i < b-a; ++i)
rc += _RANDOM(0,1);
return rc;
}
Second Answer:
The question is similar to flip coins. Each time we flip a coin, we have the same probability to get either 0 or 1. If we flip the coin for several times, the probability of getting each permutation of 0 and 1 is the same. So, if we can use each permutation to represent a distinct number between a and b, we shall get the desired RANDOM function.
How to represent a number with a serials of 0 and 1s? Binary format!
So, if we run the RANDOM(0,1) for 1+lg(b-a) times and convert the final permutation to a decimal value plus a, that's the value we want. And we need to be careful since b-a might not be exact power of 2, so we need to run RANDOM(0,1) for ceiling of 1+lg(b-a) times. But a serial of 0 and 1 of this length might represent a number exceeds b-a, we can abandon the value and restart RANDOM(a,b) till the number is smaller than b-a.
And the code is:
#include    "cmath"
#include    "iostream"
#include    "ctime"

using namespace std;
int _RANDOM()
{
   int r = rand();
   return (r%2 == 0);
}

int RANDOM(int a, int b)
{
   int rc = 0;
   int i = 0;
   // compute log2(b-a) via log10(b-a)/log10(2)
   int t = ceil(log10((float)b-a)/log10((float)2) + 1);
   unsigned int one = 0x1, zero = 0xfffffffe;
   srand(time(NULL));
   while(i < t)
   {
       rc = rc << 1;
       if(_RANDOM())
           rc |= one;
       else
           rc &= zero;
       if(i ==(t - 1)&& rc > (b-a))
       {
           rc = 0;
           i = 0; //restart loop
       }
       ++i;
   }
   return rc + a;
}

int main(int argc, char** argv)
{
   int a, b;
   cin >> a >> b;

   int r = RANDOM(a, b);
   cout << r << endl;
   return 0;
}
Monday, November 30, 2009
video player demo in android
In this post, I'll show some basic operations in android with a simple video player. The demo shows how to:
Use explicit intent
List video files with ListView, ContentProvider & MediaProvider
Retrieve data from another Activity with startActivityForResult
Play video file with VideoView
Basically, the demo is composed of two activities. The first activity (Main) is a video player with a button on it. When you click the button, the second activity(VideoSelector) shows and lists video files available on the device. Then, after you pick a video from the list, you return to Main activiry and it starts playing the video you selected.
1. Use explicit intent
On android, an intent can be implicit or explicit. An explicit intent clearly designates the component to start. Because explicit intent uses the name of target component, it's usually used inside an application. On contrast, implicit intent specifies desired action, and let the system to pick the best match component.
In our demo, we want to use the VideoSelector to select a video file, rather than the system built-in media selector, so we use explicit intent to start activity. To create explicit intent, we just need to pass the designated component class name to intent, as shown below.
The use of startActivityForResult will be explained later.
2. List video files
Android provides a ListActivity class to list data provided by a ContentProvider. We can take advantage of it to list video files available on current device rather than start from scratch. To use it, we simply make it the base class for our activity, meanwhile, add a ListView with id "@android:id/list" in the activity's layout. And the final thing we need to do is set the datasource for the list with setListAdapter method.
Android also provides a MediaProvider that can list all video files. It's the default provider when we use ContentResolver to query MediaStore.Video.Media.EXTERNAL_CONTENT_URI.
3. Get data from another activity & play video
After we select a video from the list, information of the video such as its path should be passed to the main activity for playing. The recommended way is passing it via intent object. Previously, we start the VideoSelector with startActivityForResult in Main. Being started this way, when the VideoSelector is finished, the onActivityResult method of Main will be fired. So, we need to store the selected video's path in the intent to be passed to Main. Then retrieve it in Main. As shown below:
To download full source code for this demo, you can download them from this page:
http://code.google.com/p/rxwen-blog-stuff/source/browse/#svn/trunk/android/mplayer
or with following svn command:
svn co https://rxwen-blog-stuff.googlecode.com/svn/trunk/android/mplayer
Use explicit intent
List video files with ListView, ContentProvider & MediaProvider
Retrieve data from another Activity with startActivityForResult
Play video file with VideoView
Basically, the demo is composed of two activities. The first activity (Main) is a video player with a button on it. When you click the button, the second activity(VideoSelector) shows and lists video files available on the device. Then, after you pick a video from the list, you return to Main activiry and it starts playing the video you selected.
1. Use explicit intent
On android, an intent can be implicit or explicit. An explicit intent clearly designates the component to start. Because explicit intent uses the name of target component, it's usually used inside an application. On contrast, implicit intent specifies desired action, and let the system to pick the best match component.
In our demo, we want to use the VideoSelector to select a video file, rather than the system built-in media selector, so we use explicit intent to start activity. To create explicit intent, we just need to pass the designated component class name to intent, as shown below.
               Intent i = new Intent();
               i.setClass(v.getContext(), VideoSelector.class);
               startActivityForResult(i, 0);
The use of startActivityForResult will be explained later.
2. List video files
Android provides a ListActivity class to list data provided by a ContentProvider. We can take advantage of it to list video files available on current device rather than start from scratch. To use it, we simply make it the base class for our activity, meanwhile, add a ListView with id "@android:id/list" in the activity's layout. And the final thing we need to do is set the datasource for the list with setListAdapter method.
Android also provides a MediaProvider that can list all video files. It's the default provider when we use ContentResolver to query MediaStore.Video.Media.
3. Get data from another activity & play video
After we select a video from the list, information of the video such as its path should be passed to the main activity for playing. The recommended way is passing it via intent object. Previously, we start the VideoSelector with startActivityForResult in Main. Being started this way, when the VideoSelector is finished, the onActivityResult method of Main will be fired. So, we need to store the selected video's path in the intent to be passed to Main. Then retrieve it in Main. As shown below:
@Override
protected void onListItemClick(ListView l, View v, int position, long id)
{ // in VideoSelector.java
String filePath = mCursor.getString(mCursor.getColumnIndex(MediaStore. Video.Media.DATA));
mCursor.moveToPosition(position);
Intent result = new Intent();
result.putExtra(FILE_PATH, filePath);
setResult(RESULT_OK, result);
finish();
}
@Override
protected void onActivityResult(int requestCode, int resultCode, Intent data) {
// in Main.java
super.onActivityResult(requestCode, resultCode, data);
if (RESULT_OK == resultCode) {
Bundle bd = data.getExtras();
String path = bd.getString(VideoSelector.FILE_PATH);
m_vvPlayer.setVideoPath(path);
m_vvPlayer.start();
}
}
To download full source code for this demo, you can download them from this page:
http://code.google.com/p/
or with following svn command:
svn co https://rxwen-blog-stuff.
Thursday, November 26, 2009
adb for remote connections
The adb tool in android sdk is convenient utility for debugging and control android emulators. One of its powerful features is it can forward a tcp port on local machine to an emulator running on the same machine.
After you run the adb forward tcp:hostport tcp:emuport command, your android running in emulator can listen on emuport and communicate with external applications running on host machine. From the external application's point of view, it's connecting to hostport rather than emuport. The adb is responsible for forwarding messages between the two.
But adb has a limitation of only accepting connections from the same machine, you can't connect from a machine that adb isn't running on. This limitation makes it a little bit inconvenient to do network programming. Especially on windows, if you want to use wireshark to capture the packages between emulator and external app. By default, wireshark isn't able to capture loopback packages on windows. So, we change the behavior of adb to accept remote connections.
(Another way to overcome this is instead of capturing network package on host side, we can use tcpdump on emulator side. For example, use "/data/tcpdump -s 1500 -vv -w /data/net.pcap udp port 5060" to capture all packages for udp port 5060 and save them in /data/net.pcap file. The -s parameter specifies the size of each packet whose default value is 68, too small to get some useful information truncated. The /data/net.pcap file can also be examined with wireshark.)
How to modify adb behavior
If we run netstat command on host side, we can find out that adb server process binds to the loopback address. So it can't be accessed via external address.
The adb register a port forwarding information through install_listener function. And install_listener calls local_name_to_fd function to bind to a local address. Inside local_name_to_fd, it starts a tcp server through socket_loopback_server. To change this, we can use socket_inaddr_any_server which binds to all ipaddresses. In this way, the adb server can forward a request from remote machine to emulator.
How to compile
In order to get the modified adb, we need to compile it. To do so, we first need to download all of anroid's source code. Then, at the root of andoird source directory, run ./build/envsetup.sh. Finally, run make adb.
Downloads
http://rxwen-blog-stuff.googlecode.com/files/tcpdump.zip
http://rxwen-blog-stuff.
http://rxwen-blog-stuff.
Reference
howto build SDK
Update:
Modified adb v1.0.31 can be downloaded at: https://drive.google.com/#folders/0B9fylkYUFfYTTGJKN0tURzJFelE
An basic introduction to SIP
What is SIP
SIP Protocol is one of widely used signaling protocol, with the main purpose of, as its name is abbreviated for, initialization session between several participants. Due to its nature, it's mainly used in VOIP, IM applications.
Basics of SIP
Because SIP is always mentioned together with other multimedia application protocols such as SDP, RTP. They are so mixed up that easily confuse beginners, like me. To make things clear, it's necessary to know SIP has nothing to do with those protocols. It can be used independently with SDP and RTP. SIP is just being lucky to be employed to work with them in many situations.
In short, their relationship is:
SDP describes the capabilities and preferences of a participant. Usually, it's included in the payload of SIP message.
SIP is the message flow that enable two or more participants to negotiate, setup, modify and terminate a session.
RTP is the protocol for transferring audio or video data after the session has been established, it usually relies on the information contains in SDP.
SIP is a text based protocol with request/response transaction model, similar to HTTP. Unlike HTTP, whose request and response always comes in pairs, SIP's request and response doesn't hold a one on one relationship. A SIP transaction may have multiple request and multiple response.
The format of SIP message is similar to HTTP's too. A message is composed of a start-line(includes method, request-uri and sip-version), several headers and a message body.
Like SMTP, the recipient of a message doesn't have to be directly accessible to the sender. A message may hop several times before it reaches the destination with the help of Proxy Server.
To better understand SIP protocol, the document SIP Protocol Structure through an Example provides a thorough illustration and it's good material for getting start.
SIP Libraries
PJSIP is a powerful sip library implemented in c. Besides SIP, it also support SDP, and has strong multi-media processing capability. It exposes APIs at different layers so that users can pick either a convenient or flexible API set at their will. It's also a highly portable library can run many operating systems, including windows and linux. The best thing is it has complete document which is rare in open source project.
MJSIP is a java based sip library with SDP, RTP supporting. It's also a convenient and complete solution for building VOIP application. But I'd say the library still have room to improve the quality, for there are some apparent spelling mistakes.
OSIP is part of of gnu project, implemented in c. By following the "do one thing, and do it well" philosophy, it solely focus on SIP and is a light weight, fast library.
References:
http://www.ietf.org/rfc/rfc3261.txt
http://en.wikipedia.org/wiki/Session_Description_Protocol
http://en.wikipedia.org/wiki/Real-time_Transport_Protocol
SIP Protocol is one of widely used signaling protocol, with the main purpose of, as its name is abbreviated for, initialization session between several participants. Due to its nature, it's mainly used in VOIP, IM applications.
Basics of SIP
Because SIP is always mentioned together with other multimedia application protocols such as SDP, RTP. They are so mixed up that easily confuse beginners, like me. To make things clear, it's necessary to know SIP has nothing to do with those protocols. It can be used independently with SDP and RTP. SIP is just being lucky to be employed to work with them in many situations.
In short, their relationship is:
SDP describes the capabilities and preferences of a participant. Usually, it's included in the payload of SIP message.
SIP is the message flow that enable two or more participants to negotiate, setup, modify and terminate a session.
RTP is the protocol for transferring audio or video data after the session has been established, it usually relies on the information contains in SDP.
SIP is a text based protocol with request/response transaction model, similar to HTTP. Unlike HTTP, whose request and response always comes in pairs, SIP's request and response doesn't hold a one on one relationship. A SIP transaction may have multiple request and multiple response.
The format of SIP message is similar to HTTP's too. A message is composed of a start-line(includes method, request-uri and sip-version), several headers and a message body.
Like SMTP, the recipient of a message doesn't have to be directly accessible to the sender. A message may hop several times before it reaches the destination with the help of Proxy Server.
To better understand SIP protocol, the document SIP Protocol Structure through an Example provides a thorough illustration and it's good material for getting start.
SIP Libraries
PJSIP is a powerful sip library implemented in c. Besides SIP, it also support SDP, and has strong multi-media processing capability. It exposes APIs at different layers so that users can pick either a convenient or flexible API set at their will. It's also a highly portable library can run many operating systems, including windows and linux. The best thing is it has complete document which is rare in open source project.
MJSIP is a java based sip library with SDP, RTP supporting. It's also a convenient and complete solution for building VOIP application. But I'd say the library still have room to improve the quality, for there are some apparent spelling mistakes.
OSIP is part of of gnu project, implemented in c. By following the "do one thing, and do it well" philosophy, it solely focus on SIP and is a light weight, fast library.
References:
http://www.ietf.org/rfc/
http://en.wikipedia.org/wiki/
http://en.wikipedia.org/wiki/
Wednesday, November 18, 2009
how to make presentation
As an IT guy, there are times we need to make technical presentation. How to do it well? I'm no expert in presentation at all, but I'd like to share my two cents through my experience.
Face your audience
It's extremely important to face your audience directly during representation. How boring it is to have a full room of guys watching you talking to a computer. Try to make contact with your audience, and know if they are confusing.
Know your audience
To know the level of your audience helps achieve a good presentation. Knowing them well means we can talk to them at appropriate level, neither too sophisticated nor trivial. And the best bet is to assume they have least experience in related fields if you can't know them well in advance.
Practice
It's never too silly to ask some of your friends to be your first audience and practice. This is your best chance to get the most objective feedback from your audience. Practice and stick to what you practiced during the actual presentation.
Prepare cue cards
Prepare some cue cards about important points of the presentation. They will be of great help when you forget something, and they also help you timing your presentation better.
Make a tape or video of your presentation/practice
Watch a video of your own presentation will be a funny thing to do. It also lets you make a better judgment of your performance and improve accordingly.
Monday, November 16, 2009
process agnostic feature
Being one of the most eye-catching terms today, android has many creative features. The most revolutionary one, in my opinion, is process agnostic. This is not a term used in official document, but I prefer to to use it since it implies this feature well enough.
One of center feature of android is the ability to easily make use of components of other applications. It's a common feature among many other systems, so how "easy" is android to distinguish it from others?
Let's first check out how others do. Generally, there are two common ways to reuse components. First, the component author can distribute the component as a library(e.g. dll, lib, so, a) that can be called by others. In this way, the reused component becomes part of the application that uses it.
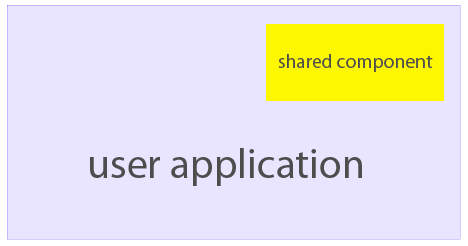 The second way is the shared component runs in a process, and the application wants to use it employs a IPC mechanism to communicate with the hosting process to make use of the component indirectly.
 Either way, we programmers must know explicitly the way we're using. And we have to pay attention to or even control the life cycle of the hosting process.
Now let's look at what's different in android. In android, components reuse and collaboration are driven by Intent. Whenever you want to make use of another component, you need to create a intent object. And state your purpose by setting corresponding properties of the intent object. Then, you pass the intent to the application framework with startActivity, startService etc. Upon receiving an intent, the application framework determines the best component for processing the intent, and asks for the user if there are multiple components can handle the intent. After a component is identified for handling the intent, an instance of the component will run. The instance may resides in the same process or in a different process with the sender of the intent. From a user's perspective, this procedure is transparent. It doesn't make difference if the component is running in another process.
The coolest thing is android also achieves process agnostic feature for end user's experience. If you dismiss current activity, android guarantees you'll return to the previous activity you worked on. Consider the following scenario, application A is showing activity X. Then the user clicks a button on activity X and starts a new activity Y from application B which runs in a different process. If, we say, when the user is still working on activity Y, the process that application A runs in dies for some reason, the user doesn't get affected and can continue with his work until he dismiss activity Y. At this time, the ActityManager notices that activity X doesn't exist, and a new instance will be created and shown. The user will still see activity X as if nothing happened. But it's not guaranteed that activity X's state is maintained correctly unless we write code to persist and restore state at right time.
Needless to say, if components from different process need to talk to each, they still have to employ some kind of IPCs because android builds on linux and uses the same underlying process model. The great thing android does for us is it hides the IPC details from us so that we can use a consistent API with less concern about complicated IPC things.
Another benefit of this design is it'll be much easier to replace a component, even if the component is a system built-in one. For example, if your application declares an intent-filter for View action for contact, it will be considered as a valid replacement for built-in contacts application by the system. Our application isn't just a second-class citizen anymore.
The process agnostic feature ensures the openness of android, it also helps making components more loosely coupled to each other.
Besides what was mentioned, it's also important to notice that the process life cycle is managed by the system automatically. The process may still keep alive after the last activity of it has been dismissed. It's also possible that the process of an inactive activity that you haven't worked for a period of time but not yet closed is terminated by the system on demand for more resources for other processes. We know that .net framework is called a managed environment because it manages components and memories for us, android takes a larger step forward by managing process life cycle as well. In this sense, it's a super managed system.
Generally speaking, in android we mainly focus on the components and how they collaborate to accomplish our goal. Less concern need to be paid on the technology details that we can't easily ignore on other platforms.
One of center feature of android is the ability to easily make use of components of other applications. It's a common feature among many other systems, so how "easy" is android to distinguish it from others?
Let's first check out how others do. Generally, there are two common ways to reuse components. First, the component author can distribute the component as a library(e.g. dll, lib, so, a) that can be called by others. In this way, the reused component becomes part of the application that uses it.
The second way is the shared component runs in a process, and the application wants to use it employs a IPC mechanism to communicate with the hosting process to make use of the component indirectly.Either way, we programmers must know explicitly the way we're using. And we have to pay attention to or even control the life cycle of the hosting process.Now let's look at what's different in android. In android, components reuse and collaboration are driven by Intent. Whenever you want to make use of another component, you need to create a intent object. And state your purpose by setting corresponding properties of the intent object. Then, you pass the intent to the application framework with startActivity, startService etc. Upon receiving an intent, the application framework determines the best component for processing the intent, and asks for the user if there are multiple components can handle the intent. After a component is identified for handling the intent, an instance of the component will run. The instance may resides in the same process or in a different process with the sender of the intent. From a user's perspective, this procedure is transparent. It doesn't make difference if the component is running in another process.
The coolest thing is android also achieves process agnostic feature for end user's experience. If you dismiss current activity, android guarantees you'll return to the previous activity you worked on. Consider the following scenario, application A is showing activity X. Then the user clicks a button on activity X and starts a new activity Y from application B which runs in a different process. If, we say, when the user is still working on activity Y, the process that application A runs in dies for some reason, the user doesn't get affected and can continue with his work until he dismiss activity Y. At this time, the ActityManager notices that activity X doesn't exist, and a new instance will be created and shown. The user will still see activity X as if nothing happened. But it's not guaranteed that activity X's state is maintained correctly unless we write code to persist and restore state at right time.
Needless to say, if components from different process need to talk to each, they still have to employ some kind of IPCs because android builds on linux and uses the same underlying process model. The great thing android does for us is it hides the IPC details from us so that we can use a consistent API with less concern about complicated IPC things.
Another benefit of this design is it'll be much easier to replace a component, even if the component is a system built-in one. For example, if your application declares an intent-filter for View action for contact, it will be considered as a valid replacement for built-in contacts application by the system. Our application isn't just a second-class citizen anymore.
The process agnostic feature ensures the openness of android, it also helps making components more loosely coupled to each other.
Besides what was mentioned, it's also important to notice that the process life cycle is managed by the system automatically. The process may still keep alive after the last activity of it has been dismissed. It's also possible that the process of an inactive activity that you haven't worked for a period of time but not yet closed is terminated by the system on demand for more resources for other processes. We know that .net framework is called a managed environment because it manages components and memories for us, android takes a larger step forward by managing process life cycle as well. In this sense, it's a super managed system.
Generally speaking, in android we mainly focus on the components and how they collaborate to accomplish our goal. Less concern need to be paid on the technology details that we can't easily ignore on other platforms.
Thursday, November 12, 2009
native and java performance on android
A lot of times when I saw someone heard that the main stream developing language on android platform is java, his first response would be "really? what about performance?". I've seen lots of similar responses when talking about c++ and c# on normal pc. Personally, I don't think argue about this question without a context makes any sense.
In most of situations, manged framework like c# and java suffice. How many times in your life do you have to implement a super powerful server that is capable of handling like one billion requests a time? Does the difference in performance really bother you? I don't think so. What play more important roles are: elegance, maintainability, clearness and number of bugs. And in a lot of situations, managed framework run at commensurate speed with c/c++ code. At least their order of growth are at the same level.
Back to the question itself. Is there significant performance difference between native and java code on android? Just see in action. The ensuing two code snippets will calculate the sum from 1 to 10,000 for 10,000 times in c and java respectively.
Having run these applications on android 1.5, we got following result:
start on: Wed Nov 11 12:13:51 2009
end on: Wed Nov 11 12:13:59 2009
total: 8 secs
start on 2009/11/11 09:12:30
end on 2009/11/11 09:13:27
total: 57 secs
The java app has been compiled in release mode for better optimization. And GC should not kick in since I only used auto variables in the sample. So I really didn't expect to see such a huge difference.
Though the performance diffs a lot, I still consider java to be the first priority choice when developing user applications. It has very convenient APIs, powerful presentation framework and great debugging support. And we still can turn to native code for extremely performance sensitive components which java can't satisfy. The official document also states that the performance of native method is 10-100X fater than java, and it suggests use native methods for performance optimization.
In most of situations, manged framework like c# and java suffice. How many times in your life do you have to implement a super powerful server that is capable of handling like one billion requests a time? Does the difference in performance really bother you? I don't think so. What play more important roles are: elegance, maintainability, clearness and number of bugs. And in a lot of situations, managed framework run at commensurate speed with c/c++ code. At least their order of growth are at the same level.
Back to the question itself. Is there significant performance difference between native and java code on android? Just see in action. The ensuing two code snippets will calculate the sum from 1 to 10,000 for 10,000 times in c and java respectively.
 1 #include
 2 #include
 3
 4 int main ( int argc, char *argv[] )
 5 {
 6     int i = 0, j = 0;
 7     FILE *f = fopen("/data/perf_c.log", "a");
 8
 9     int rc = 0;
10
11     time_t t;
12     time(&t);
13     fprintf(f, "Start on: %s\n", ctime(&t));
14
15     for(i = 0; i < 10000; ++i)
16     {
17         for(j = 0; j < 10000; ++j)
18             rc += j;
19         rc = 0;
20     }
21
22     time(&t);
23     fprintf(f, "End on: %s\n", ctime(&t));
24     return 0;
25 }                // ----------  end of function main  ----------
 1 package com.rmd;
 2
 3 import java.io.FileNotFoundException;
 4 import java.io.FileOutputStream;
 5 import java.io.PrintStream;
 6 import java.text.SimpleDateFormat;
 7 import java.util.Date;
 8
 9 import android.app.Activity;
10 import android.content.Context;
11 import android.os.Bundle;
12 import android.util.Log;
13
14 public class main extends Activity {
15     /** Called when the activity is first created. */
16     @Override
17     public void onCreate(Bundle savedInstanceState) {
18         Log.v("perf_test", "before loop");
19         try {
20             FileOutputStream fos = this.openFileOutput(
21                     "perf_java.log", Context.MODE_APPEND);
22             int rc = 0, i, j;
23             PrintStream ps = new PrintStream(fos);
24             Date dt = new Date();
25             SimpleDateFormat sdf = new SimpleDateFormat("yyyy/MM/dd hh:mm:ss");
26             ps.printf("start on\t" + sdf.format(dt) + "\n");
27             for (i = 0; i < 10000; ++i) {
28                 for(j = 0; j < 10000; ++j)
29                     rc += j;
30                 rc = 0;
31             }
32             dt = new Date();
33             ps.printf("end on\t\t" + sdf.format(dt) + "\n");
34             ps.close();
35         } catch (FileNotFoundException ex) {
36             Log.e("log_perf_test", "can't open file\n" + ex.getMessage());
37         }
38         Log.v("perf_test", "after loop");
39
40         super.onCreate(savedInstanceState);
41         setContentView(R.layout.main);
42     }
43 }
Having run these applications on android 1.5, we got following result:
start on: Wed Nov 11 12:13:51 2009
end on: Wed Nov 11 12:13:59 2009
total: 8 secs
start on 2009/11/11 09:12:30
end on 2009/11/11 09:13:27
total: 57 secs
The java app has been compiled in release mode for better optimization. And GC should not kick in since I only used auto variables in the sample. So I really didn't expect to see such a huge difference.
Though the performance diffs a lot, I still consider java to be the first priority choice when developing user applications. It has very convenient APIs, powerful presentation framework and great debugging support. And we still can turn to native code for extremely performance sensitive components which java can't satisfy. The official document also states that the performance of native method is 10-100X fater than java, and it suggests use native methods for performance optimization.
Wednesday, November 11, 2009
logging in android
Android provides a set of powerful log utilities to make our developing life easier. If you've ever used the OutputDebugString function and the DebugView on windows, you'll find they works very similar to android's counterpart in the sense of user experience. We can start the application normally, then start DDMS at anytime we want to view the application's log message.
How to use the logging system
The android logging system defines a set of APIs to be used in our code. These functions have similar signature but different verbosity level.Only error, warning and info logs are always kept. Verbose and debug are intended for using in development stage only.
To use them, we just need to add a function call to Log API in the place in our code that we have interests with desired message. The first argument tag identifies the caller. It's a good practice to define a constant string for this tag. Use hard coded string within the function call directly makes our code harder to maintain.
Performance concern
The android logging system is so powerful and user friendly that we can easily make excessive use of it in our code. But does it bring any performance penalty to our application? Let's try out this with an experiment. The idea is pretty simple, we'll make a loop of 10,000 iteration and perform logging in each iteration. And we'll record the time before and after the loop in a log file (/data/data/package_name/files/log_perf.log).
The code snippet below does this. It exercises the logging loop each time we click on a button.
After we downloaded the apk file to the emulator, we'll run the application five times in different circumstances, with and without DDMS running to see if there is any difference.
From the log file above, we can see that the loop takes about 1 second to finish without DDMS running or having adbd process killed. And the loop takes about 3 seconds to finish if DDMS is running and capturing log message. On average, Log.v function runs at the level of tenth of millisecond. So, I tend to believe we don't need to bother much about performance penalty. It's more important to have correct logic and easier debugging facility.
How to use the logging system
The android logging system defines a set of APIs to be used in our code. These functions have similar signature but different verbosity level.Only error, warning and info logs are always kept. Verbose and debug are intended for using in development stage only.
To use them, we just need to add a function call to Log API in the place in our code that we have interests with desired message. The first argument tag identifies the caller. It's a good practice to define a constant string for this tag. Use hard coded string within the function call directly makes our code harder to maintain.
Performance concern
The android logging system is so powerful and user friendly that we can easily make excessive use of it in our code. But does it bring any performance penalty to our application? Let's try out this with an experiment. The idea is pretty simple, we'll make a loop of 10,000 iteration and perform logging in each iteration. And we'll record the time before and after the loop in a log file (/data/data/package_name/
The code snippet below does this. It exercises the logging loop each time we click on a button.
package com.rmd;

import java.io.FileNotFoundException;
import java.io.FileOutputStream;
import java.io.PrintStream;
import java.text.SimpleDateFormat;
import java.util.Date;

import android.app.Activity;
import android.content.Context;
import android.os.Bundle;
import android.util.Log;
import android.view.View;
import android.widget.Button;

public class main extends Activity {
 /** Called when the activity is first created. */
 @Override
 public void onCreate(Bundle savedInstanceState) {
  super.onCreate(savedInstanceState);
  setContentView(R.layout.main);

  Button btn = (Button) this.findViewById(R.id.btnGenerateLog);
  btn.setOnClickListener(new View.OnClickListener() {

   @Override
   public void onClick(View v) {
    System.gc();
    try {
     FileOutputStream fos = v.getContext().openFileOutput("log_perf.log",
       Context.MODE_APPEND);
     PrintStream ps = new PrintStream(fos);
     Date dt = new Date();
     SimpleDateFormat sdf = new SimpleDateFormat("yyyy/MM/dd hh:mm:ss");
     ps.printf("start on\t" + sdf.format(dt) + "\n");
     for (int i = 0; i < 10000; ++i) {
      Log.v("log_perf_test", "hello raymond");
     }
     dt = new Date();
     ps.printf("end on\t\t" + sdf.format(dt) + "\n");
     ps.close();
    } catch (FileNotFoundException ex) {
     Log.e("log_perf_test", "can't open file\n" + ex.getMessage());
    }
   }
  });
 }
}
After we downloaded the apk file to the emulator, we'll run the application five times in different circumstances, with and without DDMS running to see if there is any difference.
-- DDMS turned off --
start on    2009/11/09 09:33:11
end on      2009/11/09 09:33:12
start on    2009/11/09 09:33:17
end on      2009/11/09 09:33:18
start on    2009/11/09 09:33:20
end on      2009/11/09 09:33:21
start on  2009/11/09 09:33:30
end on      2009/11/09 09:33:31
start on    2009/11/09 09:33:33
end on      2009/11/09 09:33:34

-- DDMS truned on --
start on    2009/11/09 09:33:59
end on      2009/11/09 09:34:02
start on    2009/11/09 09:34:05
end on      2009/11/09 09:34:08
start on    2009/11/09 09:34:11
end on      2009/11/09 09:34:14
start on    2009/11/09 09:34:17
end on      2009/11/09 09:34:20
start on    2009/11/09 09:35:06
end on        2009/11/09 09:35:10

-- /sbin/adbd killed --
start on    2009/11/09 09:35:53
end on      2009/11/09 09:35:54
start on    2009/11/09 09:35:57
end on      2009/11/09 09:35:59
start on    2009/11/09 09:36:01
end on      2009/11/09 09:36:02
start on    2009/11/09 09:36:05
end on      2009/11/09 09:36:06
start on    2009/11/09 09:36:08
end on      2009/11/09 09:36:09
From the log file above, we can see that the loop takes about 1 second to finish without DDMS running or having adbd process killed. And the loop takes about 3 seconds to finish if DDMS is running and capturing log message. On average, Log.v function runs at the level of tenth of millisecond. So, I tend to believe we don't need to bother much about performance penalty. It's more important to have correct logic and easier debugging facility.
Monday, November 9, 2009
native programming on android
Besides programming with java, we're also able to do native programming with c or c++ on android platform.
To do so, we need a cross compiler target on arm processor for our working platform( windows or linux). So I downloaded Sourcery G++ Lite 2009q3-68 for ARM EABI, the tool chain for arm. If you're careful enough, you would have noticed my mistake which took me a day to figure out. Unfortunately, I downloaded the wrong tool chain. The correct one is Sourcery G++ Lite 2009q3-67 for ARM GNU/Linux. This toolchain is used for target platform that runs linux operating system. If I were patient enough to read the getting started guide for the toolchain, I would found out that the first toolchain is for platforms that don't have operating system, and the second one is for linux.
From the embarrassing story, you may tell I'm still a freshman on embedded system. Surely I am. In the last embedded project I worked on, there is already a toolchain and building system up and running built by my experienced colleagues. So I don't need to care about this. Anyway, this frustrating but finally success experience gains me a lot.
Ensuing content is about the steps to build and run hello world with the toolchain.
- download the right toolchain and extract the package
- add bin to path environment variable for easier access to the toolchain
- add below source code
- compile the code with arm-none-linux-gnueabi-gcc h.c -static. -static argument is necessary here because android uses a different c library with this toolchain. we must link the application statically against c lib, otherwise, the application will fail to run on android emulator.
- download the application to emulator with: adb push hello /data/
- log onto emulator with: adb shell
- add execution permission to the application with: chmod 777 /data/hello
- run the application /data/hello and we get desired output
        #include    "stdio.h"

int main ( int argc, char *argv[] )
{
    printf("hello world!");
    return 0;
}                // ----------  end of function main  ----------
Note, because we statically linked the c library so we used the c lib provided in the codesourcery arm toolchain rather than the custom Bionic c lib comes with ndk.
Wednesday, October 28, 2009
View android source code in eclipse
It's highly desired to be able to examine and debug into android framework source code. Eric Burke showed how he figured out where to put the source code so that ecplise will associate the android.jar with the corresponding source code. Unfortunately, it didn't work after I followed him step by step.
Then I turn to procmon for help.
First, I start eclipse. Then, run procmon and add a filter of process name equals eclipse.exe. After I captured the file system activities when I tried to view a android framework class's declaration which ends in not finding the corresponding file. I noticed there is a failure on the following path: android_sdk_installation_folder\platforms\android-1.5\sources . Here we go, this must be the correct place to put android source code.
So, the solution is:
1. Create a sources folder in android_sdk_installation_folder\platforms\android-1.5\
2. Copy everything in android_1.5_cupcake_src\frameworks\base\core\java\ to android_sdk\platforms\android-1.5\sources
It's very likely that Eric is using an older version of android sdk which has different file structure from my android sdk 1.6r1. Though his blog isn't totally accurate for current version, I still want to thank him for showing me the right way to go with his smartness.
Update:
The step 2 isn't a good way to organize java file because it only put framework's source code in place. The best tool I'm aware of is this python script by Damon Kohle. He improved the one provided by Michael and it will adjust the source code organization to fit eclipse's needs.
Then I turn to procmon for help.
First, I start eclipse. Then, run procmon and add a filter of process name equals eclipse.exe. After I captured the file system activities when I tried to view a android framework class's declaration which ends in not finding the corresponding file. I noticed there is a failure on the following path: android_sdk_installation_
So, the solution is:
1. Create a sources folder in android_sdk_installation_
2. Copy everything in android_1.5_cupcake_src\
It's very likely that Eric is using an older version of android sdk which has different file structure from my android sdk 1.6r1. Though his blog isn't totally accurate for current version, I still want to thank him for showing me the right way to go with his smartness.
Update:
The step 2 isn't a good way to organize java file because it only put framework's source code in place. The best tool I'm aware of is this python script by Damon Kohle. He improved the one provided by Michael and it will adjust the source code organization to fit eclipse's needs.
Tuesday, October 27, 2009
Beginning Android Development
Recently, I get start doing some development on android platform. Having skimmed through android sdk document, I find it’s a very interesting platform with a lot of new concepts compared to other platforms. So, I'd like to write a serial of blog entries to write my understandings down. This first post is about the basic tasks of setup the development environment.
Tools:
| Tool | | Description |
| Required | The essential development tool. It contains the building system, utilities and document. | |
| Required | | |
| Eclipse with ADT plugin | Optional | It’s the officially recommended IDE to do android development. |
The installation of these tools is quite straight forward. Actually, they all support copy and run. The only requirement is $(Java SDK installation folder)/jdk/bin is added to %PATH% environment variable. I also add $(android sdk installation foler)/tools to %PATH% for easier access to android tools.
How tools work collaboratively
The SDK document includes basic development tutorials for eclipse and other IDEs. The figure below illustrates how android tools work collaboratively to create project, generate executable file and download to device/emulator.

All involved tools can be divided into three categories, android common tools, android platform specific tools and java sdk tools. Android common tools are placed in $(android sdk installation folder)/tools directory, and can be used across different android versions. Android platform specific tools are placed in $(android sdk installation folder)/platforms/android-VERSION/tools directory, and are used for a specific platform version. Java sdk tools come with the jdk installation.
When working in Eclipse, the ADT plugin invokes these tools automatically and makes them transparent to developers so that we enjoy a smooth developing experience.
How debugging tools work
Being able to debug application on android platform is very essential. Android platform comes with a power debugging support on device/emulator. The DDMS tool works as the middleman between the debuggee running on device/emulator and debugger running on developing box. The architecture is:

The work flow is:
- DDMS connects to adb and starts device monitoring
- adb scans odd-numbered ports in range from 5555 to 5585 for new device and notifies DDMS it finds one
- DDMS starts VM monitoring for the new device
- adb discovers new VM and notifies DDMS
- DDMS retrieves process id via adb
- DDMS connects to the VM debugger through adb daemon(adbd) on the device
- debugging session starts
- DDMS opens a tcp port for receiving debugging commands and directs to the VM debugger
With knowledge above, we can issue below command to use the jdb debugger (contained in Java SDK) to perform debugging on a process.
jdb -connect com.sun.jdi.SocketAttach:hostname=localhost,port=8700
Before run this command, we must run DDMS process first.
Note that according to the example provided by jdb document, jdb can attach to a process in simpler form “jdb –attach 8700”. But when I did this on windows, I got the following error message:
java.io.IOException: shmemBase_attach failed: The system cannot find the file specified
It seems jdb is using shared memory other than socket, so I have to use the complex form.
Wednesday, October 14, 2009
understanding dynamic cast
dynamic_cast is a run-time type conversion operator and it ensures only valid conversion can success. The expression dynamic_cast(src) converts expression src to dest_type if appropriate, fails otherwise. Unlike static_cast, it performs type checking at run-time, so it incurs some performance penalty.
static_cast checks if the conversion is valid at compile time. Given this expression static_cast(src), static_cast knows the declaring type of src, with this information static_cast checks if it can be converted to dest_type. If src is actually referring to another type other than src is declared to be, static_cast still considers src to be of its declaring type. So you might get unexpected behavior at run-time.
dynamic_cast takes the actual type of src into consideration. This is achieved with the help of RTTI (Run-time type information) [http://en.wikipedia.org/wiki/Run-time_type_information ] which is only available to polymorphic classes. In other words, classes with at least one virtual function defined or inherited. But why?
There are several reasons. First, it has to be compatible with c. It's clear that RTTI must be saved somewhere for each object. If we store the information in every object itself, the layout of object won't be compatible c object model any more because c++ internally add some new fields. Second, not everyone want to use dynamic_cast in their code. Is it fair for all of them to suffer the increased object size and subsequent performance penalty? So RTTI is designed to be enabled only when necessary.
Polymorphism isn't an available feature in C, and it's the source where programmer want to use dynamic_cast. So it's wisely chosen to hold RTTI. The address of a class's RTTI object is placed in virtual table of the class.
There are two requirements for a dynamic_cast to success. complete and unambiguous.
1. Complete
The src must refer to or contain a complete object of target type. For example, if src refers to an concrete object of base type and you try to cast it to derived type, it will fail.
2. Unambiguous
The src must contain a unambiguous object of target type. Take multiple inheritance for instance, it's necessary to explicitly points out which base class to convert to with scope resolution operator.
Casting in C++: Bringing Safety and Smartness to Your Programs http://www.acm.org/crossroads/xrds3-1/ovp3-1.html
static_cast checks if the conversion is valid at compile time. Given this expression static_cast
dynamic_cast takes the actual type of src into consideration. This is achieved with the help of RTTI (Run-time type information) [http://en.wikipedia.org/wiki/
There are several reasons. First, it has to be compatible with c. It's clear that RTTI must be saved somewhere for each object. If we store the information in every object itself, the layout of object won't be compatible c object model any more because c++ internally add some new fields. Second, not everyone want to use dynamic_cast in their code. Is it fair for all of them to suffer the increased object size and subsequent performance penalty? So RTTI is designed to be enabled only when necessary.
Polymorphism isn't an available feature in C, and it's the source where programmer want to use dynamic_cast. So it's wisely chosen to hold RTTI. The address of a class's RTTI object is placed in virtual table of the class.
There are two requirements for a dynamic_cast to success. complete and unambiguous.
1. Complete
The src must refer to or contain a complete object of target type. For example, if src refers to an concrete object of base type and you try to cast it to derived type, it will fail.
2. Unambiguous
The src must contain a unambiguous object of target type. Take multiple inheritance for instance, it's necessary to explicitly points out which base class to convert to with scope resolution operator.
Casting in C++: Bringing Safety and Smartness to Your Programs http://www.acm.org/crossroads/
Monday, August 24, 2009
Trace System Calls
Sometimes, it's helpful to trace system api calls during debugging so that we can determine if the incorrect behavior is caused by passing wrong argument to a function or not. Or we can try to identify the performance bottleneck with it. There are several tools to use with this purpose.
For demonstration purpose, we'll use code below to try these tools
The result of logger is saved in a binary file placed in LogExts folder, and the file need to be opened in LogViewer. The file only records all APIs being called based on their orders, so we can't identify calling relationships between them. The figure belows shows the result of tracing ProcessAndThreads and ioFunctions module: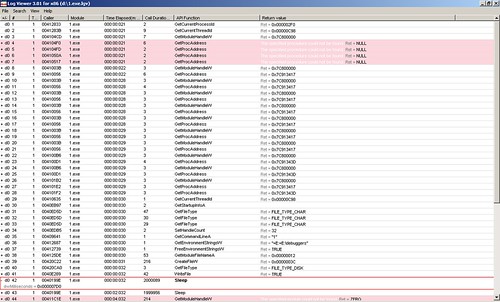 From the row #42 which is expanded, we can see the parameter passed to Sleep function is 0x000007d0 which is 2000 in decimal.
2. wt command in windbg windbg has another powerful command wt. Compared with logger extension, it has more controls over which apis shall be traced. Actually, it can also trace user's function call. And the wonderful thing with it is it can show the calling relationship with a tree. It should be a preferable way. To use it, we set a break point in the place of interest. Then issue wt command. The debugee shall continue executing until this function returns. We perform wt on the sample code, the output is:
For demonstration purpose, we'll use code below to try these tools
1 #include "Windows.h" / "unistd.h"
2 #include "fstream"
3 using namespace std;
4
5 void foo()
6 {
7 Sleep(2000); // windows
8 sleep(2); // linux
9 }
10
11 void bar()
12 {
13 ofstream of("foo.dat");
14 char buf[] = {1, 2, 3, 4, 5, 6, 7, 8, 9, 10, 11, 12, 13, 14, 15, 16};
15 of << buf;
16 of.close();
17
18 foo();
19 }
20
21 int main()
22 {
23 bar();
24 foo();
25 return 0;
26 }
1. Logger This tool can be used as a standalone application or used as a debugger extension in windbg. It's capable of keeps records of all system api calls and corresponding parameters, return value, time spent, calling module and thread. To run as a application, simply call "logger.exe application to be traced". Then you can specify some option and filter in the window popped up. But standalone logger application isn't suitable for tracing windows service. In this case, we can attach windbg to a target process and load logexts extension to work against a service.2 #include "fstream"
3 using namespace std;
4
5 void foo()
6 {
7 Sleep(2000); // windows
8 sleep(2); // linux
9 }
10
11 void bar()
12 {
13 ofstream of("foo.dat");
14 char buf[] = {1, 2, 3, 4, 5, 6, 7, 8, 9, 10, 11, 12, 13, 14, 15, 16};
15 of << buf;
16 of.close();
17
18 foo();
19 }
20
21 int main()
22 {
23 bar();
24 foo();
25 return 0;
26 }
The result of logger is saved in a binary file placed in LogExts folder, and the file need to be opened in LogViewer. The file only records all APIs being called based on their orders, so we can't identify calling relationships between them. The figure belows shows the result of tracing ProcessAndThreads and ioFunctions module:
 From the row #42 which is expanded, we can see the parameter passed to Sleep function is 0x000007d0 which is 2000 in decimal.
2. wt command in windbg windbg has another powerful command wt. Compared with logger extension, it has more controls over which apis shall be traced. Actually, it can also trace user's function call. And the wonderful thing with it is it can show the calling relationship with a tree. It should be a preferable way. To use it, we set a break point in the place of interest. Then issue wt command. The debugee shall continue executing until this function returns. We perform wt on the sample code, the output is:
0:000> wt -l 4
Tracing 1!main to return address 004096a1
3     0 [  0] 1!main
1     0 [  1]   1!ILT+540(?barYAXXZ)
12     0 [  1]   1!bar
...
37  1069 [  1]   1!bar
1     0 [  2]     1!ILT+735(?fooYAXXZ)
4     0 [  2]     1!foo
6     0 [  3]       kernel32!Sleep
37     0 [  4]         kernel32!SleepEx
8    37 [  3]       kernel32!Sleep
6    45 [  2]     1!foo
39  1121 [  1]   1!bar
...
42  1209 [  1]   1!bar
3     0 [  2]     1!__security_check_cookie
45  1212 [  1]   1!bar
4  1258 [  0] 1!main
1     0 [  1]   1!ILT+735(?fooYAXXZ)
4     0 [  1]   1!foo
6     0 [  2]     kernel32!Sleep
3     0 [  3]       kernel32!SleepEx
19     0 [  4]         kernel32!_SEH_prolog
15    19 [  3]       kernel32!SleepEx
20     0 [  4]         ntdll!RtlActivateActivationContextUnsafeFast
20    39 [  3]       kernel32!SleepEx
19     0 [  4]         kernel32!BaseFormatTimeOut
26    58 [  3]       kernel32!SleepEx
1     0 [  4]         ntdll!ZwDelayExecution
3     0 [  4]         ntdll!NtDelayExecution
31    62 [  3]       kernel32!SleepEx
4     0 [  4]         kernel32!SleepEx
36    66 [  3]       kernel32!SleepEx
9     0 [  4]         kernel32!_SEH_epilog
37    75 [  3]       kernel32!SleepEx
8   112 [  2]     kernel32!Sleep
6   120 [  1]   1!foo
7  1385 [  0] 1!main

1392 instructions were executed in 1391 events (0 from other threads)

Function Name                               Invocations MinInst MaxInst AvgInst
1!ILT+1010(??0?$basic_ofstreamDU?$char_traitsDs       1       1       1       1
1!ILT+1040(?sputn?$basic_streambufDU?$char_trai       1       1       1       1
1!ILT+1060(?close?$basic_ofstreamDU?$char_trait       1       1       1       1
1!ILT+1090(??0sentry?$basic_ostreamDU?$char_tra       1       1       1       1
1!ILT+1125(?flagsios_basestdQBEHXZ)                   1       1       1       1
1!ILT+1155(?getloc?$basic_streambufDU?$char_tra       1       1       1       1
1!ILT+1185(??0_Sentry_base?$basic_ostreamDU?$ch       1       1       1       1
1!ILT+1210(?_Osfx?$basic_ostreamDU?$char_traits       1       1       1       1
1!ILT+130(??1localestdQAEXZ)                          1       1       1       1
...
1!ILT+950(??0?$basic_streambufDU?$char_traitsDs       1       1       1       1
1!ILT+965(??1?$basic_ofstreamDU?$char_traitsDst       1       1       1       1
1!__security_check_cookie                             1       3       3       3
1!__uncaught_exception                                1       6       6       6
1!bar                                                 1      45      45      45
1!fclose                                              1      27      27      27
1!foo                                                 2       6       6       6
1!main                                                1       7       7       7
1!std::_Fiopen                                        1      29      29      29
...
1!strlen                                              1      52      52      52
kernel32!BaseFormatTimeOut                            1      19      19      19
kernel32!Sleep                                        2       8       8       8
kernel32!SleepEx                                      3       4      37      26
kernel32!_SEH_epilog                                  1       9       9       9
kernel32!_SEH_prolog                                  1      19      19      19
ntdll!NtDelayExecution                                1       3       3       3
ntdll!RtlActivateActivationContextUnsafeFast          1      20      20      20
ntdll!ZwDelayExecution                                1       1       1       1

0 system calls were executed

eax=00000000 ebx=7ffd6000 ecx=7c80240f edx=7c90e514 esi=00dcf766 edi=00dcf6f2
eip=004096a1 esp=0012ff80 ebp=0012ffc0 iopl=0         nv up ei pl zr na pe nc
cs=001b  ss=0023  ds=0023  es=0023  fs=003b  gs=0000             efl=00000246
1!__tmainCRTStartup+0xfb:
0
3. strace on linux strace is similar to logger on windows in that it only trace api calls in a flat structure.
Wednesday, August 19, 2009
Design for debugging
After we release a product to market, it's not uncommon that our customer report bugs to us, even we gained a lot of confidence from "thorough" tests by ourselves and QA guys. If it occurs, we usually don't have the luxury to perform debugging in production environment with a debugger. So, it's important we design in advance to help us debugging in this situation.
I read from 's Debugging Strategies for .NET Developers that they always have several testing boxes to run released products. And it's strictly prohibited to install any development tools on them. It seems to be an extreme stern rule and hurt debugging efficiency. But I think it's a beneficial rule for producing a great product. This way, we developers are forced to think about how to make debugging easier in this situation which may occur frequently on customers' sites.
Take microsoft's windows for example, there are plenty of ways to assist debugging in released version. Such as dr.watson for collecting dump file, error reporting mechanism, system event log, etc. Engineers at MS are doing their best to collect as much information as possible when unexpected behavior occurs. You can hardly imagine is one of your application crashes and the tech support guy from MS asked you to assist him attaching a remote debugger to your machine. Neither will we be able to.
Means:
1. Logging
It's no doubt logging will be the first one jumping into our head. Logging is a good way on customer's site since it doesn't require the customer to install any additional software to enable it. While using this feature, we must always be cautious not to simply use printf or Debug.WriteLine otherwise we'll easily be overwhelmed by a mess of log flood.
A not-bad logging system should at least be able to or have: toggle on/off, consistent style and proper layout. It's better to have the ability to set logging level to avoid log flood when possible. Preferably, we can choose a mature logging library such as log4net.
An important requirement is that the logging system could be configured without recompilation. The best way is it can even be toggled at runtime without restarting the application. DbgView is a great tool can achieve so. (Ken.Zhang explained its work mechanism in this article.)
2. Dump file
Log file has the advantage of keeping record of what's happening as time goes by, but you can only see part of information that you explicitly output. Dump file is a copy of a process on customer's site that you can examine on your developing machine to view other information missing in log. But it's a static image of the process at a fixed time. Usually, it also doesn't require install a specific software to generate dump file. Core dump on linux and Dr. Watson on windows are supported by a naked OS installation.
If we need to perform some customizations on these tools, we'd better provide a friendly GUI tool to the customer so that a average user can use.
3. Source control tag
After we released a product, it's important we keep a record of the source control system version tag correlates to the release. It's mandatory that we examine the correct code to hunt for a bug. It's not possible that we commit new code to repository after the product has been released and the most recent code doesn't match the product release. How disappointed will we be if we seem to get some clue for a bug but are not able to retrieve the correct code. So, it's important for us to find out the source control system version tag for any release.
BTW, on windows, it's also important to keep a copy of related symbol file for each release. Refer to: PDB Files: What Every Developer Must Know by John Robbins
4. Information collector
The product should have at least passed testing in the development department. So we usually need to focus on the difference between the customer's environment and our own. Those difference are very likely to be the culprit. msinfo32.exe is a good candidate for this goal.
Friday, August 14, 2009
Use trace point in windbg
In visual studio, we can add trace point while debugging. It's a helpful feature to analyze the behavior of a program without breaking the execution of the target process. Isn't it useful if you debug a multi-thread process?
At first glance, it seems to be just an alternative for System.Diagnostics.Debug.WriteLine. But we don't have to write these code anymore. Say if we want to examine the behavior at some point that we didn't use WriteLine, use trace point, we don't need to stop the process, modify code, compile and run again. Just attach the visual studio to the process, set a break point and change it to trace point. It's done.
What about on-site debugging? It's common that we use windbg in this scenario. We can also take advantage of similar feature in windbg. When set a break point in windbg, you can also specify a command string that will be executed automatically while the break point is hit. The command string can be composed of several statements that will be executed in sequence.
Here is a sample code, suppose we want to trace when and where foo is invoked:
Then we compile and execute the code. Now attach the windbg to the target and add a break point with:
Note that we need at least public symbol file to debug this.
Every time foo is invoked, following output will be printed in the debugger. And the process continues.
Let's explain the preceding command string. It composes of three statements. First, echo a string saying we enter the foo function. Then, print the call stack with k command. Finally, use g command to continue the process.
At first glance, it seems to be just an alternative for System.Diagnostics.Debug.
What about on-site debugging? It's common that we use windbg in this scenario. We can also take advantage of similar feature in windbg. When set a break point in windbg, you can also specify a command string that will be executed automatically while the break point is hit. The command string can be composed of several statements that will be executed in sequence.
Here is a sample code, suppose we want to trace when and where foo is invoked:
#include "Windows.h"

void foo()
{
Sleep(2000);
}

int main()
{
while(true)
foo();
return 0;
}
Then we compile and execute the code. Now attach the windbg to the target and add a break point with:
bp foo ".echo enter foo;k;g;"Note that we need at least public symbol file to debug this.
Every time foo is invoked, following output will be printed in the debugger. And the process continues.
enter foo ChildEBP RetAddr 0012ff54 004010d3 1!foo [d:\documents and settings\raymond\desktop\dbg\1.cpp @ 35] 0012ff78 0040138c 1!main+0x53 [d:\documents and settings\raymond\desktop\dbg\ 1.cpp @ 45] 0012ffc0 7c816fe7 1!__tmainCRTStartup+0xfb [f:\dd\vctools\crt_bld\self_ x86\crt\src\crt0.c @ 266] 0012fff0 00000000 kernel32!BaseProcessStart+0x23
Let's explain the preceding command string. It composes of three statements. First, echo a string saying we enter the foo function. Then, print the call stack with k command. Finally, use g command to continue the process.
Monday, August 3, 2009
View memory usage
I came across some questions about how to evaluate the memory usage of a process. It seems to be an easy task since most operating systems have provided a set of powerful tools to investigate memory usage. But what confuses the users is the power and complexity of these tools. And different tools may use different term to refer the same concept which shall aggravate the confusion. In this post, I'd try to make things more clear.
Basic concepts:
From a process's point of view, the physical memory isn't directly visible. What is visible to it is the virtual memory space. In other words, each process is given an illusion that there is a memory space (usually 4GB on 32bit system) for it to use exclusively. The OS's memory manager will be responsible for translating the virtual address to physical address. The active process's virtual space doesn't have to be resident in physical memory as a whole. It's managed in pages with a platform dependent granularity, which is 4kb on 32bit windows. Only those pages are currently being used need to be in physical memory. Other pages can be placed in paging file.
When the process attempts to use a virtual address that isn't in physical memory yet, a page fault is triggered. Page fault handler will swap the missing page from paging file to physical memory. Then the faulting instruction which references the missing page will be executed again to visit the page that is now available. The process even doesn't know this happens, it feels that it can use that virtual address directly.
It's common that some standard components are shared by different processes, e.g., the .net framework code can be shared by different .net application. It's a waste of memory if there are several copies in physical memory. The OS allows virtual pages of different process being mapped to the same physical pages to save memory usage.
Let's look at the image below.

There are two processes and their virtual memory layout, organized in pages. Virtual pages in blue color have corresponding page mapped in physical memory, e.g., VP1, VP5, etc. Pink page(VP7) isn't mapped in memory. Yellow page(Page2) in physical memory is a shared page that has several pages(VP1 and VP5) mapped to it.
Understand data in memory monitor:
So, we know that the memory of a process may exist in physical memory or paging file on file system. The utilities we used to monitoring memory usage can show us these data separately.
Microsoft uses different performance counter to monitor them.
Working set is the part of pages that have been swapped in physical memory, so it's usually the one for users who want to know how many memory does an application uses. But it's not very accurate, because the shared pages are counted for every process uses it. It corresponds to memory usage column in Task Manager.
Private bytes is the size of committed memory excluding shared pages. This value indicates the footprint of a process. It corresponds to VM size in Task Manager. Confusing naming convention, right?
Virtual size is the size of committed memory plus the size of reserved memory. It doesn't hurt performance if there is a huge reserved memory because allocating reversed memory doesn't have a significant cost. The memory manager can simply mark a region in virtual space as being reserved without doing actual allocation. This information isn't available in Task Manager.
It's better to use Process Explorer in sysinternal suit to monitor memory because it supplies more information and the naming convention is consistent with Performance Monitor.
On linux platform, command "ps aux" or "ps" can be used to view memory usage. VSZ (virtual set size) and RSS (resident set size) corresponds to virtual size and working set on windows respectively. But it also has the problem of not being accurate for reporting shared pages several times.
Code Sample:
Here is a sample application (windows specific) demonstrates the impacts of different type of allocations of memory.
The image below shows the result for each allocation type in performance monitor.
For type 1, both private bytes and virtual bytes increases. Working set doesn't change because the memory isn't used.
For type 2, private bytes, virtual bytes and working set all increase because the memory is allocated and used.
For type 3, only virtual bytes increases because the memory isn't committed. Subsequently, memory manager doesn't allocate memory in paging file. This block of memory can't be used until it's committed. Otherwise, access violation is reported.
For type 4 and 5, the result is the same as type 1 and 2 since the heap manger is built on top of virtual memory allocation.

Here are some excerpts from microsoft's perfmon utility:
Page File Bytes:
Page File Bytes is the current amount of virtual memory, in bytes, that this process has reserved for use in the paging file(s). Paging files are used to store pages of memory used by the process that are not contained in other files. Paging files are shared by all processes, and the lack of space in paging files can prevent other processes from allocating memory. If there is no paging file, this counter reflects the current amount of virtual memory that the process has reserved for use in physical memory.
Private Bytes:
Private Bytes is the current size, in bytes, of memory that this process has allocated that cannot be shared with other processes.
Virtual Bytes:
Virtual Bytes is the current size, in bytes, of the virtual address space the process is using. Use of virtual address space does not necessarily imply corresponding use of either disk or main memory pages. Virtual space is finite, and the process can limit its ability to load libraries.
Working Set:
Working Set is the current size, in bytes, of the Working Set of this process. The Working Set is the set of memory pages touched recently by the threads in the process. If free memory in the computer is above a threshold, pages are left in the Working Set of a process even if they are not in use. When free memory falls below a threshold, pages are trimmed from Working Sets. If they are needed they will then be soft-faulted back into the Working Set before leaving main memory.
Get memory usage in code:
Sometimes, it's useful to get memory information in code. There are system apis for this purpose.
GetProcessMemoryInfo and GlobalMemoryStatusEx funtions on windows and getrusage function on linux. It's trivial to provide sample here since preceding links have done.
Basic concepts:
From a process's point of view, the physical memory isn't directly visible. What is visible to it is the virtual memory space. In other words, each process is given an illusion that there is a memory space (usually 4GB on 32bit system) for it to use exclusively. The OS's memory manager will be responsible for translating the virtual address to physical address. The active process's virtual space doesn't have to be resident in physical memory as a whole. It's managed in pages with a platform dependent granularity, which is 4kb on 32bit windows. Only those pages are currently being used need to be in physical memory. Other pages can be placed in paging file.
When the process attempts to use a virtual address that isn't in physical memory yet, a page fault is triggered. Page fault handler will swap the missing page from paging file to physical memory. Then the faulting instruction which references the missing page will be executed again to visit the page that is now available. The process even doesn't know this happens, it feels that it can use that virtual address directly.
It's common that some standard components are shared by different processes, e.g., the .net framework code can be shared by different .net application. It's a waste of memory if there are several copies in physical memory. The OS allows virtual pages of different process being mapped to the same physical pages to save memory usage.
Let's look at the image below.

There are two processes and their virtual memory layout, organized in pages. Virtual pages in blue color have corresponding page mapped in physical memory, e.g., VP1, VP5, etc. Pink page(VP7) isn't mapped in memory. Yellow page(Page2) in physical memory is a shared page that has several pages(VP1 and VP5) mapped to it.
Understand data in memory monitor:
So, we know that the memory of a process may exist in physical memory or paging file on file system. The utilities we used to monitoring memory usage can show us these data separately.
Microsoft uses different performance counter to monitor them.
Working set is the part of pages that have been swapped in physical memory, so it's usually the one for users who want to know how many memory does an application uses. But it's not very accurate, because the shared pages are counted for every process uses it. It corresponds to memory usage column in Task Manager.
Private bytes is the size of committed memory excluding shared pages. This value indicates the footprint of a process. It corresponds to VM size in Task Manager. Confusing naming convention, right?
Virtual size is the size of committed memory plus the size of reserved memory. It doesn't hurt performance if there is a huge reserved memory because allocating reversed memory doesn't have a significant cost. The memory manager can simply mark a region in virtual space as being reserved without doing actual allocation. This information isn't available in Task Manager.
It's better to use Process Explorer in sysinternal suit to monitor memory because it supplies more information and the naming convention is consistent with Performance Monitor.
On linux platform, command "ps aux" or "ps" can be used to view memory usage. VSZ (virtual set size) and RSS (resident set size) corresponds to virtual size and working set on windows respectively. But it also has the problem of not being accurate for reporting shared pages several times.
Code Sample:
Here is a sample application (windows specific) demonstrates the impacts of different type of allocations of memory.
 1 #include
 2 #include
 3 using namespace std;
 4
 5 const int ALLOCATION_SIZE = 1024*1024;
 6
 7 int main()
 8 {
 9     int cmd;
10     void* wildptr;
11     char* buf = new char[ALLOCATION_SIZE];
12     for(int i = 0; i < ALLOCATION_SIZE; ++i)
13         buf[i] = static_cast<char>(i % 128);
14     while(true)
15     {
16         cout << "allocation type:\n\
17             1: comitted memory\n\
18             2: comitted memory and use\n\
19             3: reversed memory\n\
20             4: new obj on default heap\n\
21             5: new obj on default heap and use\n";
22         cmd = 0;
23         cin >> cmd;
24         switch(cmd)
25         {
26             case 1:
27                 wildptr = VirtualAlloc(NULL, ALLOCATION_SIZE, MEM_COMMIT,
                        PAGE_EXECUTE_READWRITE);
29                 break;
30             case 2:
31                 wildptr = VirtualAlloc(NULL, ALLOCATION_SIZE, MEM_COMMIT,
                         PAGE_EXECUTE_READWRITE);
33                 memcpy(wildptr, buf, ALLOCATION_SIZE);
34                 break;
35             case 3:
36                 wildptr = VirtualAlloc(NULL, ALLOCATION_SIZE, MEM_RESERVE,
                          PAGE_EXECUTE_READWRITE);
39                 break;
40             case 4:
41                 wildptr = new char[ALLOCATION_SIZE];
43                 break;
44             case 5:
45                 wildptr = new char[ALLOCATION_SIZE];
47                 memcpy(wildptr, buf, ALLOCATION_SIZE);
48                 break;
49             default:
50                 exit(0);
51         }
52     }
53     return 0;
54 }
The image below shows the result for each allocation type in performance monitor.
For type 1, both private bytes and virtual bytes increases. Working set doesn't change because the memory isn't used.
For type 2, private bytes, virtual bytes and working set all increase because the memory is allocated and used.
For type 3, only virtual bytes increases because the memory isn't committed. Subsequently, memory manager doesn't allocate memory in paging file. This block of memory can't be used until it's committed. Otherwise, access violation is reported.
For type 4 and 5, the result is the same as type 1 and 2 since the heap manger is built on top of virtual memory allocation.

Here are some excerpts from microsoft's perfmon utility:
Page File Bytes:
Page File Bytes is the current amount of virtual memory, in bytes, that this process has reserved for use in the paging file(s). Paging files are used to store pages of memory used by the process that are not contained in other files. Paging files are shared by all processes, and the lack of space in paging files can prevent other processes from allocating memory. If there is no paging file, this counter reflects the current amount of virtual memory that the process has reserved for use in physical memory.
Private Bytes:
Private Bytes is the current size, in bytes, of memory that this process has allocated that cannot be shared with other processes.
Virtual Bytes:
Virtual Bytes is the current size, in bytes, of the virtual address space the process is using. Use of virtual address space does not necessarily imply corresponding use of either disk or main memory pages. Virtual space is finite, and the process can limit its ability to load libraries.
Working Set:
Working Set is the current size, in bytes, of the Working Set of this process. The Working Set is the set of memory pages touched recently by the threads in the process. If free memory in the computer is above a threshold, pages are left in the Working Set of a process even if they are not in use. When free memory falls below a threshold, pages are trimmed from Working Sets. If they are needed they will then be soft-faulted back into the Working Set before leaving main memory.
Get memory usage in code:
Sometimes, it's useful to get memory information in code. There are system apis for this purpose.
GetProcessMemoryInfo and GlobalMemoryStatusEx funtions on windows and getrusage function on linux. It's trivial to provide sample here since preceding links have done.
Subscribe to:
Posts (Atom)