Nowadays, drag and drop is a frequently seen feature on touch screen devices. Tthis post introduces the basic idea of how to implement drag and drop on android.
On android, touch event is composed of a series events.
First, user puts his finger on an element, and the element receives a ACTION_DOWN event.
Then, while holding finger on screen, user moves his finger to a new location. The element receives a series of ACTION_MOVE events.
Finally, user raises his finger. At this point, the element receives ACTION_UP event.
Consider the figure below, the parent element has a child element inside. User can drag the child element anywhere in parent.
There are two important traits of touch event on android.
First, touch event will be propagated. That is, if a child chooses to ignore the first event (ACTION_DOWN) by returning false in its onTouchEvent handler, the parent's onTouchEvent handler will receive the event. Unless one of the ancestors agrees to handle the event or the root is reached, the event will continually be propagated.
Second, parent can intercept the touch event before its child's onTouchEvent handler is fired. This is achieved by overriding the onInterceptTouchEvent method on parent, and returning true from it. As a consequence, the child's onTouchEvent handler will be bypassed, and the parent's onTouchEvent handler will fire.
The work flow is shown in below diagram:
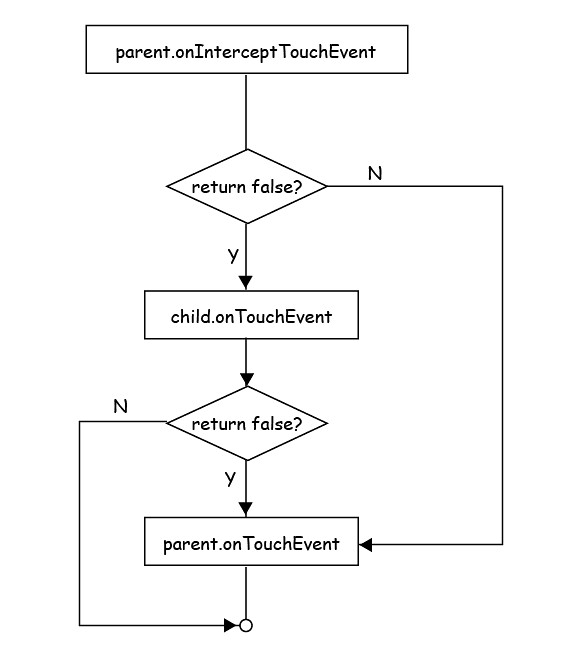
We need to setup the onTouchEvent handler for both child and parent. In child's handler, we save the child element as the item to be dragged, and return false so that subsequent event will be delivered to parent's handler. In parent's handler, we change the child's margin to match the position of the finger, so the child will follow our finger.
Sample code:
http://code.google.com/p/rxwen-blog-stuff/source/browse/#svn/trunk/android/drag
Reference:
http://developer.android.com/guide/topics/ui/ui-events.html
Thursday, July 29, 2010
Wednesday, July 28, 2010
nook's battery sucks
nook's battery is advertised to be able to run for around 10 days if users trun off the wifi. But my nook can only run for 4 days at maximum, even if I always turn air mode on. On average, I used it for two or three hours per day. That's to say, its battery can only support 12 hours normal usage! It seems the culprit is even in sleep mode, the nook still consumes a lot of battery. In this review for nook, it's said nook consumes battery while turned off !! Ridiculous!
Labels:
nook
Sunday, July 18, 2010
why offsetof can use null pointer
offsetof is a widely used means in c and c++ to find out the offset of a member variable in its struct or class. The most normal way to implement it is via following macro:
Everything is clear and simple. But wait, look at how we retrieve the address of the member, it's deferencing a pointer to 0. Why id doesn't give us a segmentation fault?
To understand this, let's check the c code below which retrieve the offset of member c in struct foo.
It's clear that the compiler doesn't blindly follow the null pointer to get its member variable's address. Instead, because the compiler knows the structure and layout of struct foo, it adds the offset (which is already known to the compiler) of member c to the starting address of struct foo to find out the address of c.
offset doesn't access memory pointed to by the null pointer. That's why we didn't get invalid memory access error while using a null pointer.
#define offsetof(st, m) ((size_t) ( (char *)&((st *)(0))->m - (char *)0 ))
The idea is very simple. We declare a target type pointer pointing at address 0, then we retrieve the address of its member variable. Because the start address is 0, the value of the pointer to member is the offset.Everything is clear and simple. But wait, look at how we retrieve the address of the member, it's deferencing a pointer to 0. Why id doesn't give us a segmentation fault?
To understand this, let's check the c code below which retrieve the offset of member c in struct foo.
1 #include "stdio.h"
2
3 struct foo
4 {
5 int a;
6 char b;
7 int c;
8 };
9
10 int main ( int argc, char *argv[] )
11 {
12 struct foo* fp = (struct foo*)0;
13 unsigned int offset = (unsigned int)&fp->c;
14 printf("offset of c is %u\n", offset);
15 return 0;
16 } // ---------- end of function main ----------
Then compile it with miscrosoft's c++ compiler, and dump the revelant assembly code generated by the compiler. We got this:2
3 struct foo
4 {
5 int a;
6 char b;
7 int c;
8 };
9
10 int main ( int argc, char *argv[] )
11 {
12 struct foo* fp = (struct foo*)0;
13 unsigned int offset = (unsigned int)&fp->c;
14 printf("offset of c is %u\n", offset);
15 return 0;
16 } // ---------- end of function main ----------
1 _main:
2 00401010: 55 push ebp
3 00401011: 8B EC mov ebp,esp
4 00401013: 83 EC 08 sub esp,8
5 00401016: C7 45 FC 00 00 00 mov dword ptr [ebp-4],0
6 00
7 0040101D: 8B 45 FC mov eax,dword ptr [ebp-4]
8 00401020: 83 C0 08 add eax,8
9 00401023: 89 45 F8 mov dword ptr [ebp-8],eax
10 00401026: 8B 4D F8 mov ecx,dword ptr [ebp-8]
11 00401029: 51 push ecx
12 0040102A: 68 5C DC 41 00 push 41DC5Ch
13 0040102F: E8 14 00 00 00 call _printf
14 00401034: 83 C4 08 add esp,8
15 00401037: 33 C0 xor eax,eax
16 00401039: 8B E5 mov esp,ebp
17 0040103B: 5D pop ebp
18 0040103C: C3 ret
2 00401010: 55 push ebp
3 00401011: 8B EC mov ebp,esp
4 00401013: 83 EC 08 sub esp,8
5 00401016: C7 45 FC 00 00 00 mov dword ptr [ebp-4],0
6 00
7 0040101D: 8B 45 FC mov eax,dword ptr [ebp-4]
8 00401020: 83 C0 08 add eax,8
9 00401023: 89 45 F8 mov dword ptr [ebp-8],eax
10 00401026: 8B 4D F8 mov ecx,dword ptr [ebp-8]
11 00401029: 51 push ecx
12 0040102A: 68 5C DC 41 00 push 41DC5Ch
13 0040102F: E8 14 00 00 00 call _printf
14 00401034: 83 C4 08 add esp,8
15 00401037: 33 C0 xor eax,eax
16 00401039: 8B E5 mov esp,ebp
17 0040103B: 5D pop ebp
18 0040103C: C3 ret
It's clear that the compiler doesn't blindly follow the null pointer to get its member variable's address. Instead, because the compiler knows the structure and layout of struct foo, it adds the offset (which is already known to the compiler) of member c to the starting address of struct foo to find out the address of c.
offset doesn't access memory pointed to by the null pointer. That's why we didn't get invalid memory access error while using a null pointer.
Labels:
c++
Saturday, July 17, 2010
got nook
Finally, after more than two weeks' waiting, my nook was delivered to me.
nook and accessories:
screensaver:
main menu:
viewing pdf:
micro-sd card socket:
There are two set of go to previous/next buttons on both left and right side of nook for user's convenience. But they are rather hard to press, and make tick noise upon pressing. A bit annoying if use it in a quiet environment. Then I found in nook's manual that the touch screen in the bottom can also be used for navigation. After the touch screen goes dark, I can swipe my finger on it to navigate. A quick (must be quick enough) swipe from right to left turns to next page, and the oppisite direction turns to previous page. No noise at all.
A flaw with this clever design is the direction of swiping on touch screen is different from the hard button's arrow direction. The hard previous button has a left arrow on it. But the direction for turnning to previous page is from left to right. So wierd.
nook and accessories:
screensaver:
main menu:
viewing pdf:
micro-sd card socket:
There are two set of go to previous/next buttons on both left and right side of nook for user's convenience. But they are rather hard to press, and make tick noise upon pressing. A bit annoying if use it in a quiet environment. Then I found in nook's manual that the touch screen in the bottom can also be used for navigation. After the touch screen goes dark, I can swipe my finger on it to navigate. A quick (must be quick enough) swipe from right to left turns to next page, and the oppisite direction turns to previous page. No noise at all.
A flaw with this clever design is the direction of swiping on touch screen is different from the hard button's arrow direction. The hard previous button has a left arrow on it. But the direction for turnning to previous page is from left to right. So wierd.
Labels:
nook
Wednesday, July 7, 2010
performance impact of printf
Logging is a widely used debugging means. As a way of implementing logging, I saw printf used in a lot of places. It's so quick and easy to use printf to examine the behavior of an application. But it also has heavy impact of the performance of the application, meanwhile, it makes our logging a mess and difficult to read without careful forethought.
The code snippet below calculates the fibonacci number. On line eight, I used printf to print some values. Very simple code. I compiled the code with different printf statement on line eight and run the application to see the performance.
The list below shows the time ticks spent with different printf statements, in decreasing order.
It's very clear that the performance drops dramatically if the printf statement is there, and the more complex the format string is, the poorer the performance is. The performance is even 2000 times poorer if we compare the worst case and best case.
The reason is printf needs to invoke system call to output data, which incur a lot of transitions between user mode and kernel mode. And a complex format string also consumes a lot of processing time.
In order to get rid of the performance penalty, yet keep the capability of saving log. We must use a mature logging system, instead of printf directly. An ideal logging system should support switch, logging level and many output mechanisms.
While writing code, we're always enticed to use printf simply because it's easy to write. In contrast, a logging system should require us spending 10 minutes to understand and use. But, the time spent really deserves, considering the time we must spend later on organizing and cleaning printf statement and the possible performance impact of printf.
The code snippet below calculates the fibonacci number. On line eight, I used printf to print some values. Very simple code. I compiled the code with different printf statement on line eight and run the application to see the performance.
1 int fib(int a)
2 {
3 int rc = 0;
4 if(a < 2)
5 rc = a;
6 else
7 rc = fib(a-1) + fib(a-2);
8 printf("rc = %d, a = %d\n", rc, a);
9 return rc;
10 }
11
12 int main(int argc, char* argv[])
13 {
14 int t1 = GetTickCount();
15 printf("before fib: %d\n", t1);
16 int result = fib(16);
17
18 int t2 = GetTickCount();
19 printf("after fib: %d %d %d \n", t2, t2 - t1, result);
20 return 0;
21 }
22
2 {
3 int rc = 0;
4 if(a < 2)
5 rc = a;
6 else
7 rc = fib(a-1) + fib(a-2);
8 printf("rc = %d, a = %d\n", rc, a);
9 return rc;
10 }
11
12 int main(int argc, char* argv[])
13 {
14 int t1 = GetTickCount();
15 printf("before fib: %d\n", t1);
16 int result = fib(16);
17
18 int t2 = GetTickCount();
19 printf("after fib: %d %d %d \n", t2, t2 - t1, result);
20 return 0;
21 }
22
The list below shows the time ticks spent with different printf statements, in decreasing order.
4188 (printf("rc = %d, a = %d\n", rc, a) )
3617 (printf("helloworld"))
844 (printf("a"))
858 (printf("%d\n", rc))
302 (printf("%d", rc))
2 (no printf)
3617 (printf("helloworld"))
844 (printf("a"))
858 (printf("%d\n", rc))
302 (printf("%d", rc))
2 (no printf)
It's very clear that the performance drops dramatically if the printf statement is there, and the more complex the format string is, the poorer the performance is. The performance is even 2000 times poorer if we compare the worst case and best case.
The reason is printf needs to invoke system call to output data, which incur a lot of transitions between user mode and kernel mode. And a complex format string also consumes a lot of processing time.
In order to get rid of the performance penalty, yet keep the capability of saving log. We must use a mature logging system, instead of printf directly. An ideal logging system should support switch, logging level and many output mechanisms.
While writing code, we're always enticed to use printf simply because it's easy to write. In contrast, a logging system should require us spending 10 minutes to understand and use. But, the time spent really deserves, considering the time we must spend later on organizing and cleaning printf statement and the possible performance impact of printf.
Labels:
c++,
performance
Monday, July 5, 2010
paste in vim command line
To be able to paste something to vim's command line is a feature makes our life a lot easier. For instance, say we want to change a frequently used variable name in c source file from a_super_long_inproper_variable_for_caching_bank_account_balance to balance. To replace all of the variable's occurrence, we plan to use following replace command:
Luckily, vim has at least two ways to rescue us from having to type the name.
1. command-line window
command-line window is a separate window that enables us editing command just like working in a normal window. Plus, it lists command history. So, we can easily copy the variable name via yank command and paste it to command-line window. To open the command-line window, we can type q: while in normal mode. For more information about command-line window, see help q: in vim.
2. paste with Ctrl+R shortcut key combination
Instead of opening a separate command-line window, we can also paste directly in vim command line. While editing within command line, we can use Ctrl+R, Ctrl+W key combination to paste the word currently under cursor in last window to command line. Beside the forgoing shortcut key, vim features a lot of key combination that let us paste from different sources, like registers, file name, etc. Run :help c_CTRL-R to find more out its real power.
Reference:
Vim documentation: cmdline
:%s/a_super_long_inproper_variable_for_caching_bank_account_balance/balance/g
Without paste capability, we have to type the variable name ourself, maybe several times because we doom to type the name wrong.Luckily, vim has at least two ways to rescue us from having to type the name.
1. command-line window
command-line window is a separate window that enables us editing command just like working in a normal window. Plus, it lists command history. So, we can easily copy the variable name via yank command and paste it to command-line window. To open the command-line window, we can type q: while in normal mode. For more information about command-line window, see help q: in vim.
2. paste with Ctrl+R shortcut key combination
Instead of opening a separate command-line window, we can also paste directly in vim command line. While editing within command line, we can use Ctrl+R, Ctrl+W key combination to paste the word currently under cursor in last window to command line. Beside the forgoing shortcut key, vim features a lot of key combination that let us paste from different sources, like registers, file name, etc. Run :help c_CTRL-R to find more out its real power.
Reference:
Vim documentation: cmdline
Labels:
productivity,
tools
Thursday, July 1, 2010
perform profiling on windows ce
Profiling is an effective way of finding out bottlenecks in an application. On windows ce platform, profiling can also be done easily.
To perform profiling for native code, we can use the /callcap compiler option to enable callcap profiling. After it's enabled, the compiler will inject method invocation to _CAP_Enter_Function and _CAP_Exit_Function upon entering and returnning from a function respectively. We can print or log current time in these method to achieve profiling.
It's notable that while compiling the source file contains _CAP_Enter_Function and _CAP_Exit_Function's definition, we must disable /callcap option, otherwise, these function will call themself recursively. In most cases, it's a wise idea to create a library project to implement these profiling hook fuction and trun /callcap off for the project. Then link the library to other applications to be profiled.
For demonstration, here is a visual studio project shows how to do profiling:
http://code.google.com/p/rxwen-blog-stuff/source/browse/trunk/wince/ce_profiling/
After we run the application, we get below output:
As you can see, it's a very rough sample that only prints the address of function being called. Not convenient to analyse. We may improve it by mapping and translating the address to function name, because we, as the application developer, possess the private symbol file. This task doesn't need to be done on the windows ce box, it's much easier to save the log file then parse and analyse it on a pc.
References:
Remote call profiler
A tour of windows ce performance tools
To perform profiling for native code, we can use the /callcap compiler option to enable callcap profiling. After it's enabled, the compiler will inject method invocation to _CAP_Enter_Function and _CAP_Exit_Function upon entering and returnning from a function respectively. We can print or log current time in these method to achieve profiling.
It's notable that while compiling the source file contains _CAP_Enter_Function and _CAP_Exit_Function's definition, we must disable /callcap option, otherwise, these function will call themself recursively. In most cases, it's a wise idea to create a library project to implement these profiling hook fuction and trun /callcap off for the project. Then link the library to other applications to be profiled.
For demonstration, here is a visual studio project shows how to do profiling:
http://code.google.com/p/rxwen-blog-stuff/source/browse/trunk/wince/ce_profiling/
After we run the application, we get below output:
Enter function (at address 00011068) at 73875892
Enter function (at address 00011030) at 73875897
Enter function (at address 00011000) at 73875902
bar
Leaving function (at address 00011000) at 73876907
foo
Leaving function (at address 00011030) at 73879912
Leaving function (at address 00011068) at 73879916
Enter function (at address 00011030) at 73875897
Enter function (at address 00011000) at 73875902
bar
Leaving function (at address 00011000) at 73876907
foo
Leaving function (at address 00011030) at 73879912
Leaving function (at address 00011068) at 73879916
As you can see, it's a very rough sample that only prints the address of function being called. Not convenient to analyse. We may improve it by mapping and translating the address to function name, because we, as the application developer, possess the private symbol file. This task doesn't need to be done on the windows ce box, it's much easier to save the log file then parse and analyse it on a pc.
References:
Remote call profiler
A tour of windows ce performance tools
Friday, June 25, 2010
openoffice exports better pdf than word
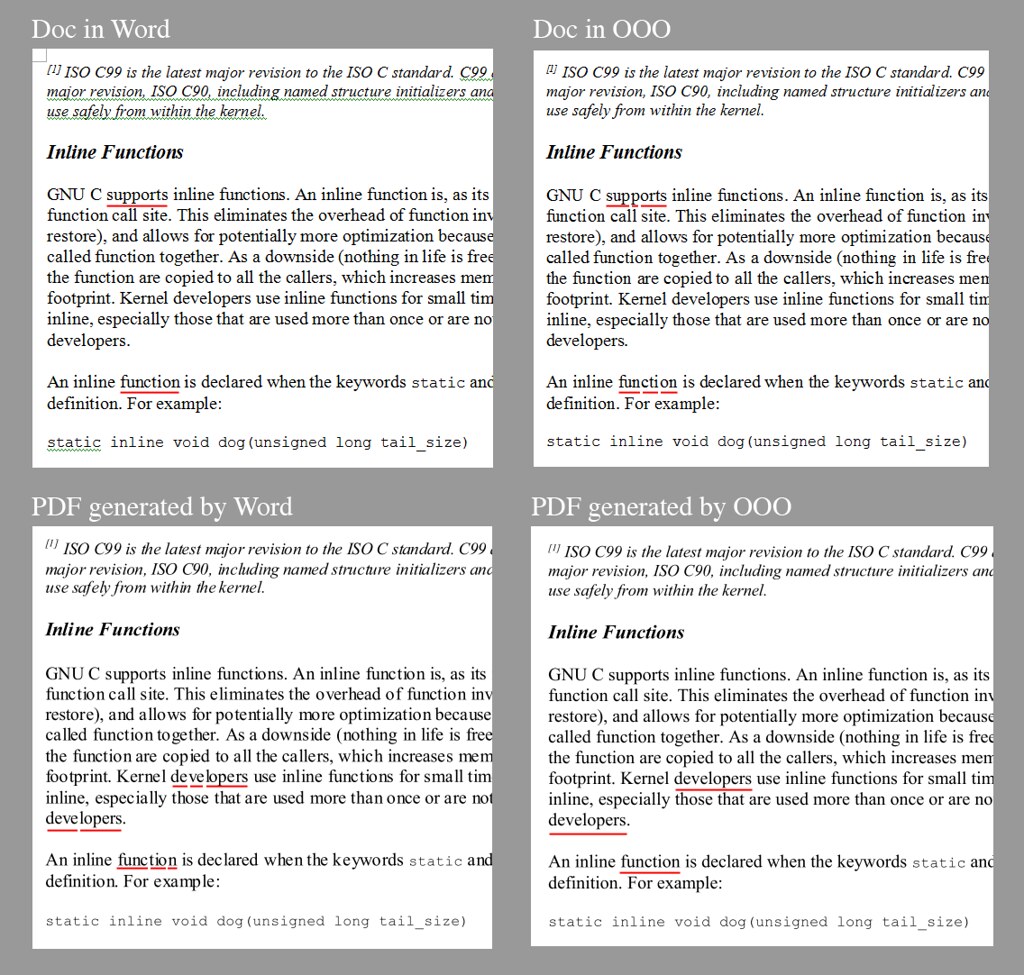
I generated a pdf file from a word document with word 2007. But the pdf file looks very uncomfortable in my pdf viewer. So I looked it closely to see what makes me feel so. The culprit is the spacing between characters. As shown in the image blow, the spacing between characters within a word varies in the pdf file, though the original word document doesn't exhibit this.
I tried to export the pdf file with openoffice again. To my surprise, the generated file looks very smooth and comfortable. The spacing between characters is perfect, just as they are in doc file. Also, the edge of the font is much more clear.
I usually don't pay much attention to details like fonts and spacing. But the performance between word and openoffice differs so much that it's hard to not to notice them. I just don't get how word deserves its price.
I tried to export the pdf file with openoffice again. To my surprise, the generated file looks very smooth and comfortable. The spacing between characters is perfect, just as they are in doc file. Also, the edge of the font is much more clear.
I usually don't pay much attention to details like fonts and spacing. But the performance between word and openoffice differs so much that it's hard to not to notice them. I just don't get how word deserves its price.
Labels:
tools
Wednesday, June 9, 2010
debugging python script in ipython
ipython doesn't work with built-in pdb debugger. While I tried to debug a python script with "run -d script.py" within ipython shell, I got bellow error:
To debug script in ipython, we need to use a different debugger, pydb, for example. There are only three steps to setup and use it.
Because pydb use the same set of commands with gdb, it's fairly straightforward to get start with it if you have done some debugging in gdb. This is one reason why I pick it as my debugger.
Reference:
Introducing the pydb Debugger
Debugging in Python
AttributeError: Pdb instance has no attribute 'curframe'
To debug script in ipython, we need to use a different debugger, pydb, for example. There are only three steps to setup and use it.
- download and install pydb.
- start ipython with -pydb argument: ipython -pydb
- start debugging with: run -d script.py
KeyError: 'HOME'
It can be solved by adding HOME environment variable.Because pydb use the same set of commands with gdb, it's fairly straightforward to get start with it if you have done some debugging in gdb. This is one reason why I pick it as my debugger.
Reference:
Introducing the pydb Debugger
Debugging in Python
Sunday, June 6, 2010
install ipython and readline on mac
ipython is a powerful interactive shell for python. With it, we can tak advantage of python programming language in our daily works.
One of ipython's power is its tab-completion feature that needs readline to work. On mac system, it lacks this library due to license issue. There is a proprietary version of readline in mac, but it doesn't work with ipython.
To install them on mac system, we can simply use easy_install utility, like this:
One of ipython's power is its tab-completion feature that needs readline to work. On mac system, it lacks this library due to license issue. There is a proprietary version of readline in mac, but it doesn't work with ipython.
To install them on mac system, we can simply use easy_install utility, like this:
sudo easy_install ipython readline
Saturday, May 22, 2010
use ffmpeg to setup streaming server on android
ffmpeg is a powerful media library. It provides ffserver tool that can be used to setup a streaming server.
Here is how to compile ffmpeg for android, using CodeSourcery's cross compiler.
1. Download and extract ffmpeg source code.
2. Use below commands to compile ffmpeg
4. Transfer ffserver tool, ffserver.conf file (defines what media files will be served by ffserver) and media files to android with adb push command
5. Start streaming server with ./ffserver -f ffserver.conf on andoird shell
Below is a sample ffserver.conf file, which tells the ffserver to listen on rtsp port 7654. It defines two media files for streaming, /data/1.mp3 and /data/1.mp4, respectively. So make sure these files exist.
To test ffserver, we can start a media player that supports media streaming, and open the url: rtsp://{ip address of the android device}:7654/1.mp3.
Here is how to compile ffmpeg for android, using CodeSourcery's cross compiler.
1. Download and extract ffmpeg source code.
2. Use below commands to compile ffmpeg
./configure --arch=arm --cross-prefix=arm-none-linux-gnueabi- --extra-ldflags=-static --target-os=linux
make
3. Run file ffserver && readelf ffserver -d or arm-none-linux-gnueabi-objdump ffserver -x | grep NEEDED commands to make sure ffserver is statically linkedmake
4. Transfer ffserver tool, ffserver.conf file (defines what media files will be served by ffserver) and media files to android with adb push command
5. Start streaming server with ./ffserver -f ffserver.conf on andoird shell
Below is a sample ffserver.conf file, which tells the ffserver to listen on rtsp port 7654. It defines two media files for streaming, /data/1.mp3 and /data/1.mp4, respectively. So make sure these files exist.
# Port on which the server is listening. You must select a different
# port from your standard HTTP web server if it is running on the same
# computer.
Port 8090
# Address on which the server is bound. Only useful if you have
# several network interfaces.
BindAddress 0.0.0.0
# Port on which the server is listening. You must select a different
# port from your standard HTTP web server if it is running on the same
# computer.
RTSPPort 7654
# Address on which the server is bound. Only useful if you have
# several network interfaces.
RTSPBindAddress 0.0.0.0
# Number of simultaneous requests that can be handled. Since FFServer
# is very fast, it is more likely that you will want to leave this high
# and use MaxBandwidth, below.
MaxClients 1000
# This the maximum amount of kbit/sec that you are prepared to
# consume when streaming to clients.
MaxBandwidth 1000
# Access log file (uses standard Apache log file format)
# '-' is the standard output.
CustomLog -
# Suppress that if you want to launch ffserver as a daemon.
NoDaemon
<Stream 1.mp4>
Format rtp
File "/data/1.mp4"
</Stream>
<Stream 1.mp3>
Format rtp
File "/data/1.mp3"
</Stream>
# port from your standard HTTP web server if it is running on the same
# computer.
Port 8090
# Address on which the server is bound. Only useful if you have
# several network interfaces.
BindAddress 0.0.0.0
# Port on which the server is listening. You must select a different
# port from your standard HTTP web server if it is running on the same
# computer.
RTSPPort 7654
# Address on which the server is bound. Only useful if you have
# several network interfaces.
RTSPBindAddress 0.0.0.0
# Number of simultaneous requests that can be handled. Since FFServer
# is very fast, it is more likely that you will want to leave this high
# and use MaxBandwidth, below.
MaxClients 1000
# This the maximum amount of kbit/sec that you are prepared to
# consume when streaming to clients.
MaxBandwidth 1000
# Access log file (uses standard Apache log file format)
# '-' is the standard output.
CustomLog -
# Suppress that if you want to launch ffserver as a daemon.
NoDaemon
<Stream 1.mp4>
Format rtp
File "/data/1.mp4"
</Stream>
<Stream 1.mp3>
Format rtp
File "/data/1.mp3"
</Stream>
To test ffserver, we can start a media player that supports media streaming, and open the url: rtsp://{ip address of the android device}:7654/1.mp3.
Labels:
android,
multimedia
Friday, May 21, 2010
invisible directshow render window
A common task we may want to achieve while creating a media application is to start media playback on a new thread, as the sample below shows:
http://code.google.com/p/rxwen-blog-stuff/source/browse/trunk/multimedia/directshow/dbg_directshow_thread_issue/dbg_directshow_thread_issue.cpp
In the menu of the sample, there are two items. "Render File" will start playback on main thread of the application. "Render New Thread" will create a new thread to playback. Everything work fine in the first case, but in the second case, the directshow rendering window isn't visible, I can only hear sound.
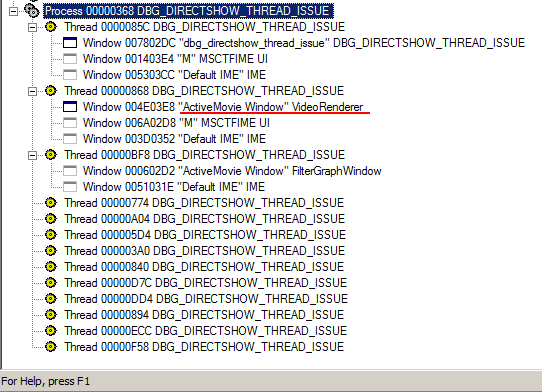
Then I debugged the application with spy++. The image below shows all windows when the media is rendered on main thread. There is a VideoRenderer window exists on main thread.
In contrast, the image below shows all windows when the media is rendered on a new thread. The VideoRenderer window doesn't exist.
I added two lines of code at the end of Render method to block the new thread so it didn't exit after the media playback started. This time, the render window can be seen. All windows are shown below, in which the VideoRenderer window is there.
Actually, the issue has to do with windows working mechanism. A window's window procedure executes on the thread that creates the window. If the corresponding thread ends, the window will also end. That's why we have to keep the new thread from exiting to keep the VideoRenderer window alive.
[quotation from programming windows by Charles Petzold]
Although Windows programs can have multiple threads of execution, each thread's message queue handles messages for only the windows whose window procedures are executed in that thread. In other words, the message loop and the window procedure do not run concurrently. When a message loop retrieves a message from its message queue and calls DispatchMessage to send the message off to the window procedure, DispatchMessage does not return until the window procedure has returned control back to Windows.
However, the window procedure could call a function that sends the window procedure another message, in which case the window procedure must finish processing the second message before the function call returns, at which time the window procedure proceeds with the original message. For example, when a window procedure calls UpdateWindow, Windows calls the window procedure with a WM_PAINT message. When the window procedure finishes processing the WM_PAINT message, the UpdateWindow call will return controls back to the window procedure.
This means that window procedures must be reentrant. In most cases, this doesn't cause problems, but you should be aware of it. For example, suppose you set a static variable in the window procedure while processing a message and then you call a Windows function. Upon return from that function, can you be assured that the variable is still the same? Not necessarily—not if the particular Windows function you call generated another message and the window procedure changes the variable while processing that second message. This is one of the reasons why certain forms of compiler optimization must be turned off when compiling Windows programs.
In many cases, the window procedure must retain information it obtains in one message and use it while processing another message. This information must be saved in variables defined as static in the window procedure, or saved in global variables.
[/quotation]
When working with directshow, it's not necessary to create a new thread explicitly. It's fine to start playback on main thread because the main thread won't be blocked.
http://code.google.com/p/rxwen-blog-stuff/source/browse/trunk/multimedia/directshow/dbg_directshow_thread_issue/dbg_directshow_thread_issue.cpp
In the menu of the sample, there are two items. "Render File" will start playback on main thread of the application. "Render New Thread" will create a new thread to playback. Everything work fine in the first case, but in the second case, the directshow rendering window isn't visible, I can only hear sound.
Then I debugged the application with spy++. The image below shows all windows when the media is rendered on main thread. There is a VideoRenderer window exists on main thread.
In contrast, the image below shows all windows when the media is rendered on a new thread. The VideoRenderer window doesn't exist.
I added two lines of code at the end of Render method to block the new thread so it didn't exit after the media playback started. This time, the render window can be seen. All windows are shown below, in which the VideoRenderer window is there.
Actually, the issue has to do with windows working mechanism. A window's window procedure executes on the thread that creates the window. If the corresponding thread ends, the window will also end. That's why we have to keep the new thread from exiting to keep the VideoRenderer window alive.
[quotation from programming windows by Charles Petzold]
Although Windows programs can have multiple threads of execution, each thread's message queue handles messages for only the windows whose window procedures are executed in that thread. In other words, the message loop and the window procedure do not run concurrently. When a message loop retrieves a message from its message queue and calls DispatchMessage to send the message off to the window procedure, DispatchMessage does not return until the window procedure has returned control back to Windows.
However, the window procedure could call a function that sends the window procedure another message, in which case the window procedure must finish processing the second message before the function call returns, at which time the window procedure proceeds with the original message. For example, when a window procedure calls UpdateWindow, Windows calls the window procedure with a WM_PAINT message. When the window procedure finishes processing the WM_PAINT message, the UpdateWindow call will return controls back to the window procedure.
This means that window procedures must be reentrant. In most cases, this doesn't cause problems, but you should be aware of it. For example, suppose you set a static variable in the window procedure while processing a message and then you call a Windows function. Upon return from that function, can you be assured that the variable is still the same? Not necessarily—not if the particular Windows function you call generated another message and the window procedure changes the variable while processing that second message. This is one of the reasons why certain forms of compiler optimization must be turned off when compiling Windows programs.
In many cases, the window procedure must retain information it obtains in one message and use it while processing another message. This information must be saved in variables defined as static in the window procedure, or saved in global variables.
[/quotation]
When working with directshow, it's not necessary to create a new thread explicitly. It's fine to start playback on main thread because the main thread won't be blocked.
Labels:
directshow,
multimedia
Subscribe to:
Posts (Atom)