Thursday, May 20, 2010

logging with osip

As I posted before, logging is an important debugging means. In order to be truly useful and convenient, the logging module should at lease have two traits:
  1. can be turned on and off globally
  2. supports the concept of logging level
osip also comes with a mature logging system. Besides the traits I just mentioned, it also enables we  to configure log output destination, which can be a plain file, syslog, or a function pointer to a custom logging function. The function pointer enables us to save the log to any possible storage we prefer, e.g., across network.
There is a tiny bug which prevents us using the function pointer mechanism on windows platform if we compile the osip as dynamic library. The author forgot export osip_trace_initialize_func in osipparser2.def file. So our application will end in unresolved external symbol error if we use this function. To get around this, I added the line at the very end of osipparser2.def:
  osip_trace_initialize_func        @416


To use osip logging, we need to:
  1. Compile osip with ENABLE_TRACE macro defined
  2. Define ENABLE_TRACE in our application
  3. Initialize osip logging module
  4. Write log message with:  OSIP_TRACE (osip_trace(__FILE__, __LINE__, OSIP_INFO1, NULL, "log message"));
The wonderful thing is we can easily turn off logging by either undefine ENABLE_TRACE macro, or eliminate the line that initialize osip logging module. We can also trun logging message with specific logging level on and off. Very convenient.

An example is available here:
http://code.google.com/p/rxwen-blog-stuff/source/browse/trunk/protocol/osip_logging/osip_log.cpp

Monday, May 17, 2010

sip elements lifecycle

In sip protocol, the difficult thing is the liecycle of sip elements, including dialog, transaction and message. Though defined as different layers in sip, their lifecycle usually overlaps. Message is the layer at the bottom. Transaction is the layer above message, it's comprised of a sip request message (sent by UAC) and all subsequent response messages (sent by UAS) to the request. A transaction is identified by Branch parameter in Via header. On top of the transaction layer is the dialog layer, which defines a peer-to-peer relationship between participants. Its identifier is the combination of the To tag, From tag and Call-ID.
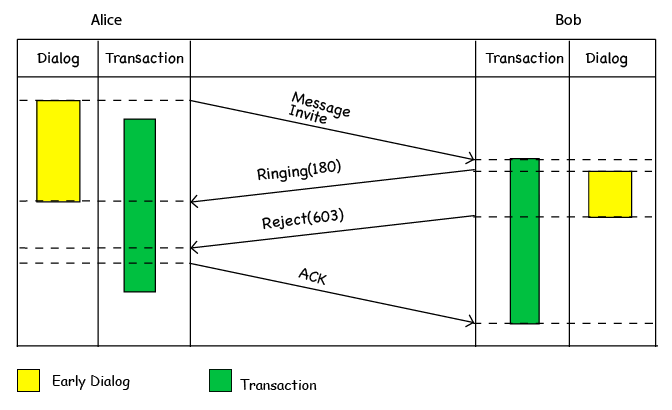
The lifecycle of elements varies depending on the actual messages exchanged. As an example, Alice called Bob, and Bob accepted the call. During the session initialization process, they exchanged a bunch of sip messages. The lifecycle of transaction and dialog elements are shown below:
(Yellow block and blue block represent the lifecyle of a dialog, indicate Early sate and Confirmed state respectively. Green block represents the lifecycle of a transaction.)
The lifecycle of elements are different if Bob rejected Alice's call. In this case, the ack message belongs to the transaction that created by the invite message, not having its own transaction anymore.


The previous example suffices to show the complexity of sip elements' lifecycle. It's import to understand the lifecycle of elements to implement a mature sip protocol stack.

The essential idea of layered design is to hide lower layer's implementation detail. In sip protocol, though it's designed as layered protocol, the lower layer isn't completely transparent.
Suppose our application runs on top of a sip protocol stack. In an ideal world, our application should only relies on the dialog layer to run. But because dialog's lifecycle doesn't fully cover the lifecycle of transactions in lower layer, our application still has to rely on transaction layer or even message layer. The dependencies on different layers of sip protocol stack make things a lot complicated.
In order to simplify things, many sip protocol stack implementations abstract another higher level layer, "call", which is not defined in sip protocol specification. The existance of this layer successfully decouples our application from those different underlying layers.

Friday, May 14, 2010

capture network traffic on windows ce

When developing network applications, it's always necessary to capture network traffic. Windows ce has built-in sniffer tool, netlog for this purpose. It captures network traffics to a file that can be examined with wireshark or network monitor.
To enable it, we need to select NDIS Packet Capturing DLL and NDIS User-mode I/O Protocol Driver in visual studio, as shown below.


Then, we can capture network traffic with following commands.

1. set capture file lacation:
netlogctl file "\Storage Card\net"
2. start capture
netlogctl start
3. perform network activities
4. stop capture
netlogctl stop
5. copy \Storage Card\net.cap[i].cap to computer and open with wireshark


NetLogctl usage:
netlogctl start - start the loggging.
netlogctl load - start the loggging.
netlogctl stop - stops the loggging.
netlogctl unload - causes networking to unload the netlog component. (may destabilize system)
netlogctl pkt_size  XX - sets maximum packet size captured.
netlogctl cap_size  XX - sets maximum  size of half capture file.
netlogctl file  XXX - sets the name of the file to log.
netlogctl usb  XXX - 1 => log usb , 0 => stop logging usb.
netlogctl state  - print state.
netlogctl trace  - print trace message state for all modules.
netlogctl trace <module> - print trace message state for specified module.
netlogctl trace <module> <filter> - set trace message state for specified module.

Monday, May 10, 2010

use googletest on windows ce

I've been trying to use googletest on windows ce platform to do unit testing. But gtest doesn't provide a windows ce project file, so I had to modify the project myself. Here is how to do so:

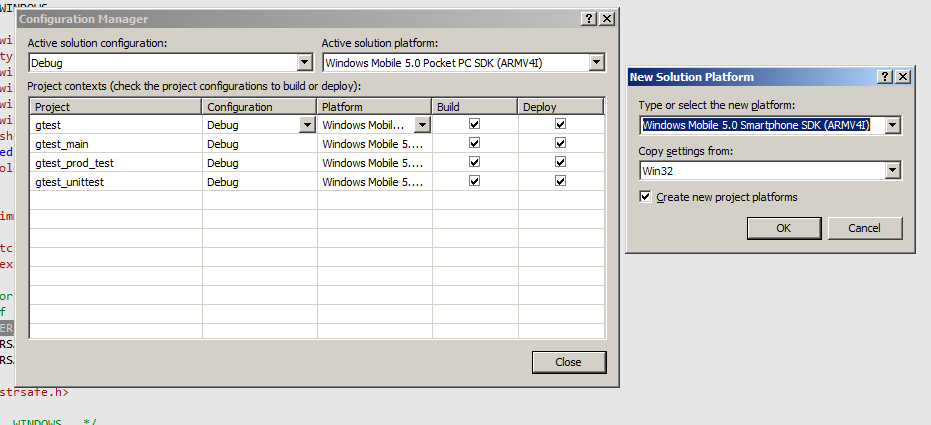
1. Add a new platform
I added a new windows ce based platform (Windows Mobile 5.0 Pocket PC SDK (ARMV4I), for example) in the configuration manager of the gtest project.


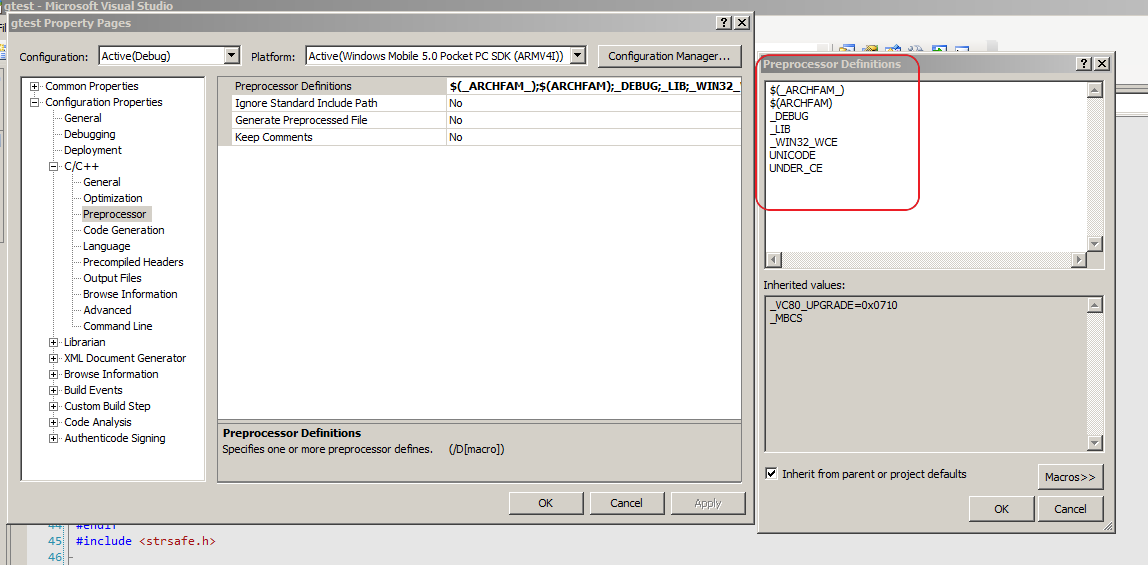
2. Add below preprocessor definitions
 In order to compile gtest library for windows ce, I used below preprocessor definitions:
 "NDEBUG;_WIN32_WCE=$(CEVER);UNDER_CE;$(PLATFORMDEFINES);WINCE;_CONSOLE;$(ARCHFAM);$(_ARCHFAM_);_UNICODE;UNICODE"

Not all of them are mandatory, but missing the bold ones may cause gtest fail to compile.


3. Create a windows ce console project
The sample project is available at:
http://code.google.com/p/rxwen-blog-stuff/source/browse/#svn/trunk/wince/ce_gtest_proj
This project expects to find gtest header file (gtest\gtest.h) and static library (gtestd.lib) in googletest folder in parent directory.

4. Run the application on emulator/device and verify output
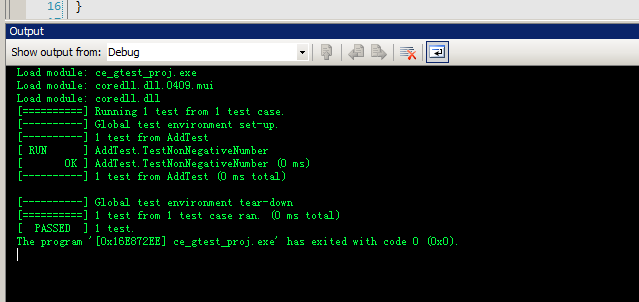
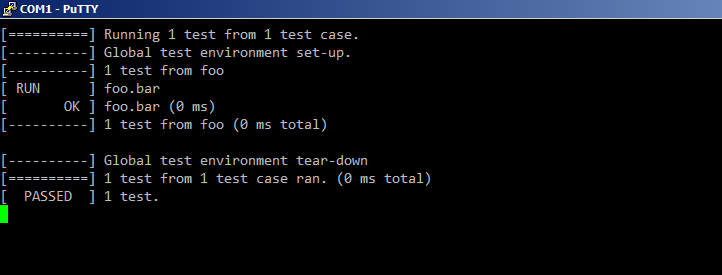
Finally, I run the unit testing application on a windows ce device, and get below outputs in visual studio and serial port output respectively. The output shows that the test case passed successfully.
visual studio output window

device serial port output


It's not always necessary to run unit testing application on windows ce device. If we write our application with care, it's possible that the application can compile and run on both win32 and windows ce platform. Then we can do unit testing on a normal pc, which will be easier and faster.
But I still would like to run the unit testing on windows ce if our product is supposed to run on it. Any subtle differences between win32 and win ce may cause the unit testing succeed on one platform but fail on the other. It's wise to do unit testing on the platform that the application will actually run.

Monday, April 26, 2010

describe intention directly before ask a question

Before asking a question, it's a good habit to describe your intention clearly. Below is a real story happened between me and a coworker.

  CW: hey, do you know how to do B on windows?
  ME: o, yes. You can:
      1. Blah blah
      2. Blah blah
      3. Blah blah
      But why you want to do this?
  CW: hmmm, because I want to do A.
  ME: Do A? Why ask B? They're not related.
  CW: Why? According to concept C, A is controlled by B.
  ME: No, you misunderstood concept C. It's blah blah
  CW: O, i see.


If he asked how to do A at the beginning, we both can save a lot of time.
When we need to ask a question, it's a sign that we don't understand the stuff very well. Then we'd better describe our intention directly. If we ask a different topic by our own deduction, which may be a misunderstanding, we may be on the wrong track.

Sunday, April 25, 2010

streaming audio on android

Streaming media refers to the capability of playing media data while the data is being transferred from server. The user doesn't need to wait until full media content has been downloaded to start playing. In media streaming, media content is split into small chunks as the transport unit. After the user's player has received sufficient chunks, it starts playing.
From the developer's perspective, media streaming is comprised of two tasks, transfer data and render data. Application developers usually concentrate more on transfer data than render data, because codec and media renderer are often available already.
On android, streaming audio is somewhat easier than video for android provides a more friendly api to render audio data in small chunks. No matter what is our transfer mechanism, rtp, raw udp or raw file reading, we need to feed chunks we received to renderer. The AudioTrack.write function enables us doing so.
AudioTrack object runs in two modes, static or stream. In static mode, we write the whole audio file to audio hardware. In stream mode, audio data are written in small chunks. The static mode is more efficient because it doesn't have the overhead of copying data from java layer to native layer, but it's not suitable if the audio file is too big to fit it memory. It's important to notice that we call play at different time in two modes. In static mode, we must call write first, then call play. Otherwise, the AudioTrack raises an exception complains that AudioTrack object isn't properly initialized. In stream mode, they are called in reverse order. Under the hood, static and stream mode determine the memory model. In static mode, audio data are passed to renderer via shared memory. Thus static mode is more efficient.

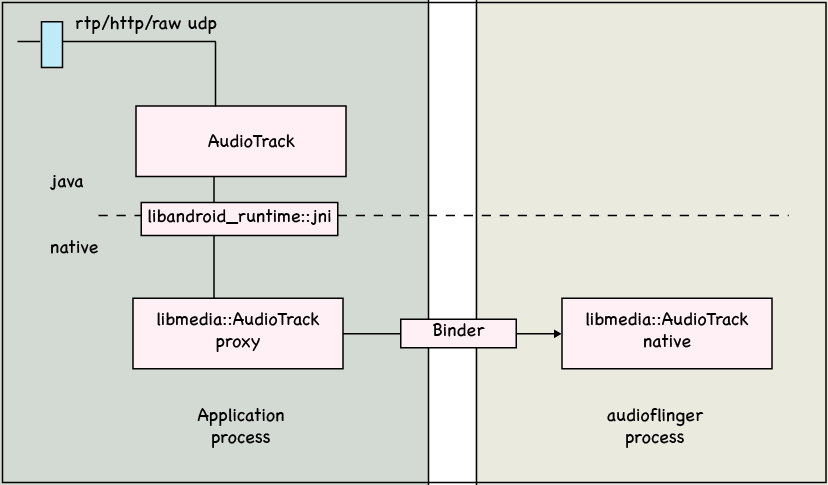
From birds eye view, the architecture of an typical audio streaming application is:

Our application receives data from network. Then the data will be passed to a java layer AudioTrack object which internally calls through jni to native AudioTrack object. The native AudioTrack object in our application is a proxy that refers to the implementation AudioTrack object resides in audioflinger process, through binder ipc mechanism. The audiofinger process will interact with audio hardware.
Since our application and audioflinger are separate processes, so after our application has written data to audioflinger, the playback will not stop even if our application exits.

AudioTrack only supports PCM (a.k.a G.711) audio format. In other words, we can't stream mp3 audio directly. We have to deal with decoding ourselves, and feed decoded data to AudioTrack.

Sample
http://code.google.com/p/rxwen-blog-stuff/source/browse/trunk/android/streaming_audio/
For demonstration purpose, this sample chooses a very simple transfer mechanism. It reads data from a wav file on disk in chunks, but we can consider it as if the data were delivered from a media server on network. The idea is similar.


Update: Check this post for a more concrete example.

Saturday, April 24, 2010

why I prefer wireshark to network monitor

Personally, I prefer wireshark to network monitor for:
  1. Wireshark runs on many platforms including windows, linux, mac os x, etc. I need to work both on linux and windows, and I'd like to keep my toolbox as compact as possible.
  2. Wireshark uses a widely adopted syntax for capture filters and disply filters which dare I call them de facto. The same syntax is used in windump and tcpdump. I don't need to remember additional syntax even work in a GUI-less environment.
  3. Filters in wireshark seems to be more powerful. For example, the filter "tcp.flags.syn==1" enables me to view tcp SYN messages only.  Based on my limited experience with network monitor, I'm not aware if it can filter at this granularity.

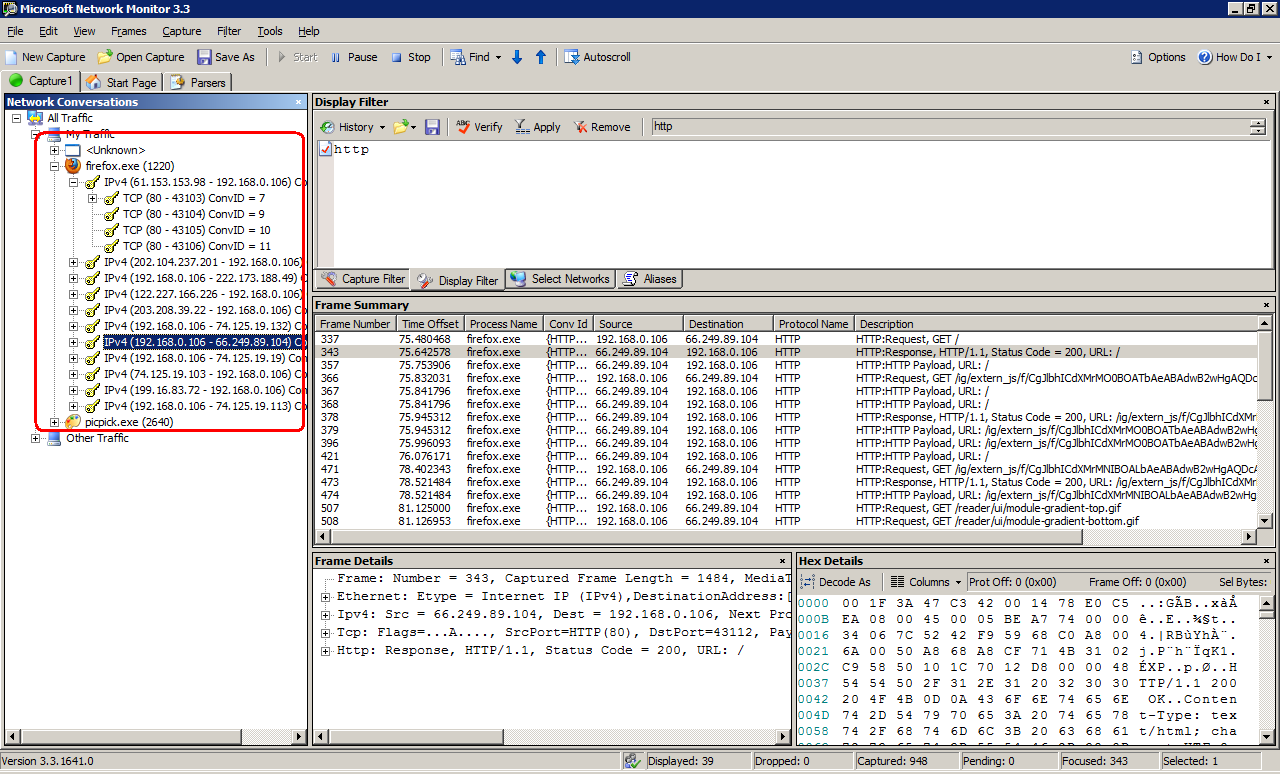
But network monitor has the advantage of being able to categorize network messages by processes. As shown in the image below:

It's a very convenient feature that helps me easily find out messages I'm interested in. Especially when I need to debug a process whose port numbers are picked at random or dynamically.

Friday, April 23, 2010

standalone windbg v6.12.0002.633

I read from Tomas's post that newer version windbg can't be downloaded from microsoft directly anymore. To get newer windbg, we have to download the huge 620 mb WDK iso and extract windbg installer from it manually. The newest windbg standalone installer is version 6.11.1.404, released on March 27, 2009.
I don't know if microsoft will listen to our customer's voice and release a standalone windbg. Before they will, for the convenience for developers like me, here is extracted windbg package:

windbg 6.12.0002.633 x86   http://rxwen-blog-stuff.googlecode.com/files/windbg_6.12.0002.633_x86.zip
md5sum:   abdad1a805f7d89d461b4569b216001d
sha1sum:  3715d726363524643a6df561bf9d27e7acb49307

windbg_6.12.0002.633_64_installer    http://rxwen-blog-stuff.googlecode.com/files/windbg_6.12.0002.633_64_installer.zip
md5sum:  62fc3d313081f96fea3f69c4d06700a1
sha1sum:  d79e6f40c08a95d5653c0eb0cc7d64c8bea8e391


A noticable change of this version is: ADPlus V7.0 is a total rewrite of ADPlus. ADPlus is now written in managed code which will allow us to add new features much easier. The old version is renamed to adplus_old.vbs. This page lists more changes of the new version.

Hope it helps.

Wednesday, April 21, 2010

Use google.com instead of google.com.hk

After google moved their service from china mainland to hongkong, I can't access google.com or google.cn from mainland anymore. I always get redirected to google.com.hk. Based off my experience with google.com.hk, it shows more noise information than google.com and google.cn. Because in most cases, results in transitional chinese aren't what I'm looking for.

To force the browser using google.com, we can visit the url http://www.google.com/ncr. After it has been visited once, all subsequent requests for google.com won't be redirected to google.com.hk anymore. Hooray!

Sunday, April 18, 2010

Override CheckMediaType with care

A problem I encountered while developing my source filter's output pin is that inside FillBuffer method, the media type and size of the media sample is not exactly the same as the one I proposed in GetMediaType method. The strange thing is my pin has successfully negotiated with downstream renderer filter (its actual type is Video Mixing Renderer-9 filter), and its input pin has agreed to use the media type my filter proposed. So why the actual media type being used changes?

The answer lies in this document, handling format changes from the video renderer:

Video Mixing Renderer Filter
The Video Mixing Renderer filter (VMR-7 and VMR-9) will connect with any format that is supported by the graphics hardware on the system. The VMR-7 always uses DirectDraw for rendering, and allocates the underlying DirectDraw surfaces when the upstream filter connects. The VMR-9 always uses Direct3D for rendering, and allocates the underlying Direct3D surfaces when the upstream filter connects.
The graphics hardware may require a larger surface stride than the image width. In that case, the VMR requests a new format by calling QueryAccept. It reports the surface stride in the biWidth member of the BITMAPINFOHEADER in the video format. If the upstream filter does not return S_OK from QueryAccept, the VMR rejects the format and tries to connect using the next format advertised by the upstream filter. The VMR attaches the media type with the new format to the first media sample. After the first sample, the format remains constant; the VMR will not switch formats while the graph is running.

During the connecting phase, after both filters' pins have agreed on a media type, they perform allocator negotiation. And the downstream pin proposed a larger biWidth during allocator negotiation. As a result to the new proposal, our pin's QueryAccept method is called. If we don't override it, the default implementation of grandpa class CBasePin comes into play. CBasePin::QueryAccept internally calls CheckMediaType method to see if the newly proposed media type can be accepted. Because our pin's CheckMediaType method's original implementation is too sloppy without examining all fields of the new media type, so we ended in the situation I described at the beginning of the post.

So, the best practice for creating a source filter is we need to handle CheckMediaType carefully. Or we can take the alternative way of overriding the QueryAccept method to handle media type change explicitly.

References:
How to Write a Source Filter for DirectShow
Core Media Technology in Windows XP Empowers You to Create Custom Audio/Video Processing Components

Sunday, April 11, 2010

Thoughts on directshow

In this post, I'll summarize some features that make directshow stand out, from a developer's point of view.

The architecture of directshow is:

The core of directshow framework is the box in the center.

1. separation of concerns
Directshow divides a complex media rendering task into a bunch of smaller tasks, organized as different filters. Each filter has its own concentration, e.g., grabbing data from source media file, decoding data, rendering the data on display. It's more natural and easier for our brain to resolve complex problems in smaller steps, one by one. Another benefit of this breakdown structure is we can perform unit test on smaller component more easily.

2. mature abstraction layer
Directshow provides a mature abstraction layer on top of sub-tasks' concrete implementations (Adapter pattern). The existence of the abstraction layer makes our project easier to manage. The cost for dealing with changes can be minimized. For example, we can have one guy tries to implement a hardware based decoder filter. And before his filter is available, other guys in charge of other parts can use a software based decoder filter instead. After the hardware based filter is done, it's hopeful to replace the software based filter without requiring changes on other parts because interfaces of both filters are the same.

3. built-in multimedia functions
Besides being a sophisticated core framework, directshow also contains a lot of commonly used multimedia features like common media type decoders, some splitters, and multi-stream synchronizer. With these features built-in, we developers' life will be a lot easier.

References
MSDN: Directshow System Overview
http://en.wikipedia.org/wiki/DirectShow

Saturday, April 3, 2010

directshow debugging tips

1. View graph
When we render a media file, directshow uses intelligent connect to build a working graph for us. It may add some filters implicitly if necessary. From my perspective, it all happens transparently. It's user friendly and powerful. But while debugging, we need to know exactly how is the graph constructed and connected, at runtime. Directshow provided a utility method AddGraphToRot in %WINSDK%\Samples\multimedia\directshow\common\dshowutil.h. We can use it to register our graph to running object table, and then view the graph in graphedit. After the graph has been registered, we select File - Connect to Remote Graph in graphedit to bring up remote filter graph list. Then select the registered graph to view.


2. Keep log
IGraphBuilder exposes a SetLogFile method that can be used to specify a log file. Once set, all of the graph's activities will be saved to the log file, including how filter's are connected, how the graph attempted to connect pins. These information are valuable for debugging filters.
pGraph->SetLogFile((DWORD_PTR)CreateFile(TEXT("C:\\graph_builder.log"), GENERIC_WRITE, 0, NULL, CREATE_NEW, FILE_ATTRIBUTE_NORMAL, NULL));

3. Dump graph
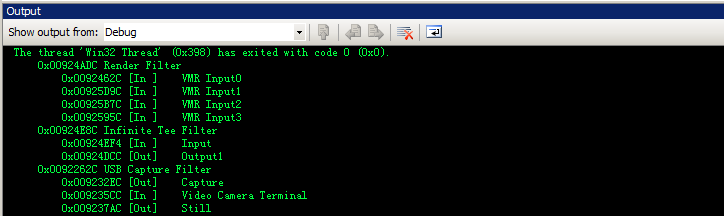
In the log file generated by graph, components (filter and pin) are identified with their address in memory. The friendly name of the component isn't shown which make the log file harder to understand by human. Here is a small utility function that dumps all filters and their pins with corresponding memory address and name, in the format shown below.