Tuesday, August 30, 2011

ease android stacktrace examination in vim with agdb

Continue the post view call stack of crashed application on android.
The agdb tool is able to convert PC register to source file information, but not convenient enough. After agdb outputs source file information, we still need to open the source file in vim and jump to the corresponding line manually.
Now agdb tool can generate a vim specific error file for the stacktrace to help us jump to source code directly.
Still consider the stacktrace below:


22 F/ASessionDescription(   33): frameworks/base/media/libstagefright/rtsp/ASessionDescription.cpp:264 CHECK_GT( end,s) failed:  vs.
23 I/DEBUG   (   30): *** *** *** *** *** *** *** *** *** *** *** *** *** *** *** ***
24 I/DEBUG   (   30): Build fingerprint: 'generic/generic/generic:2.3.1/GINGERBREAD/eng.raymond.20101222.130550:eng/test-keys'
25 I/DEBUG   (   30): pid: 33, tid: 450  >>> /system/bin/mediaserver <<<
26 I/DEBUG   (   30): signal 11 (SIGSEGV), code 1 (SEGV_MAPERR), fault addr deadbaad
27 I/DEBUG   (   30):  r0 deadbaad  r1 0000000c  r2 00000027  r3 00000000
28 I/DEBUG   (   30):  r4 00000080  r5 afd46668  r6 40806c10  r7 00000000
29 I/DEBUG   (   30):  r8 8031db1d  r9 0000fae0  10 00100000  fp 00000001
30 I/DEBUG   (   30):  ip ffffffff  sp 40806778  lr afd19375  pc afd15ef0  cpsr 00000030
31 I/DEBUG   (   30):          #00  pc 00015ef0  /system/lib/libc.so
32 I/DEBUG   (   30):          #01  pc 00001440  /system/lib/liblog.so
33 I/DEBUG   (   30):
34 I/DEBUG   (   30): code around pc:
35 I/DEBUG   (   30): afd15ed0 68241c23 d1fb2c00 68dae027 d0042a00
36 I/DEBUG   (   30): afd15ee0 20014d18 6028447d 48174790 24802227
37 I/DEBUG   (   30): afd15ef0 f7f57002 2106eb56 ec92f7f6 0563aa01
38 I/DEBUG   (   30): afd15f00 60932100 91016051 1c112006 e818f7f6
39 I/DEBUG   (   30): afd15f10 2200a905 f7f62002 f7f5e824 2106eb42
40 I/DEBUG   (   30):
41 I/DEBUG   (   30): code around lr:
42 I/DEBUG   (   30): afd19354 b0834a0d 589c447b 26009001 686768a5
43 I/DEBUG   (   30): afd19364 220ce008 2b005eab 1c28d003 47889901
44 I/DEBUG   (   30): afd19374 35544306 d5f43f01 2c006824 b003d1ee
45 I/DEBUG   (   30): afd19384 bdf01c30 000281a8 ffffff88 1c0fb5f0
46 I/DEBUG   (   30): afd19394 43551c3d a904b087 1c16ac01 604d9004
47 I/DEBUG   (   30):
48 I/DEBUG   (   30): stack:
49 ........................
92 I/DEBUG   (   30):     408067e4  6f697470
93 I/BootReceiver(   75): Copying /data/tombstones/tombstone_09 to DropBox (SYSTEM_TOMBSTONE)

We run this command to convert it to vim error file:
agdb.py -v < tombstone_01.txt > vim_error_file
# the -v argument tells agdb to generate a vim error file

Then in vim, we run :cg vim_error_file to load the error file to vim's quickfix buffer.
After the error file is loaded, we run :cw command in vim to examine the call stack. It's shown below:

1 pid: 33, tid: 450  >>> /system/bin/mediaserver <<<
2 /path_to_android_src_root/bionic/libc/unistd/abort.c:82: #00 __libc_android_abort
3 /path_to_android_src_root/system/core/liblog/logd_write.c:235: #01 __android_log_assert
Now we can focus on the line that we'd like to further investigate, and press enter. Vim will bring us the the exact line that the error corresponds to.

The idea of the feature is very simple. As we vim users know, vim is able to recognize lots of compilers' error message. The agdb tool converts the format of stacktrace to gcc compiler's error format, then vim can load the output to quickfix and associate lines with corresponding source code.

Saturday, August 27, 2011

fix "bad class file error" android build error

I got the error below while building android source code:
packages/apps/Calculator/src/com/android/calculator2/CalculatorDisplay.java:19: cannot access android.content.Context
bad class file: android/content/Context.class(android/content:Context.class)

The error is caused by using an incorrect version of jdk. Google recommend using sun-java6-jdkto build android source code. On my pc, besides sun jdk that installed, openjdk and fastjar are installed by default. And they're used to build android, rather than sun-jdk. To make sure that sun jdk is used, I used commands below to select sun jdk.

sudo update-alternatives --config java
sudo update-alternatives --config jar

Typical output is shown below, and android build successfully after I select sun jdk.
There are 2 choices for the alternative jar (providing /usr/bin/jar).


  Selection    Path                             Priority   Status
------------------------------------------------------------
  0            /usr/bin/fastjar                  100       auto mode
  1            /usr/bin/fastjar                  100       manual mode
* 2            /usr/lib/jvm/java-6-sun/bin/jar   63        manual mode

Monday, August 22, 2011

access android source via https protocol

Update: no need to use this trick anymore, since google has changed the default protocol to https.


repo is a good tool for android source tree management. It manages all git repositories for all android subprojects. By default, it clones these project via git: protocol, which is more efficient to work with than http. But the git: protocol accesses 9418 port, which may be blocked by firewalls, especially when we're using it within a restricted network environment. In this case, it's desired to be able to access android source tree with http: protocol.
The site kernel.org that hosts android source code supports https: protocol, so we can change the config file in .git folder for each android subproject to force using https: protocol. The bash command below does the job:
find -regex ".*.git/config" -exec sed -i s/git:/https:/ {} \;
To change it back to git protocol, exchange git: and https: in the command.

Sunday, July 31, 2011

modify CE code for our platform

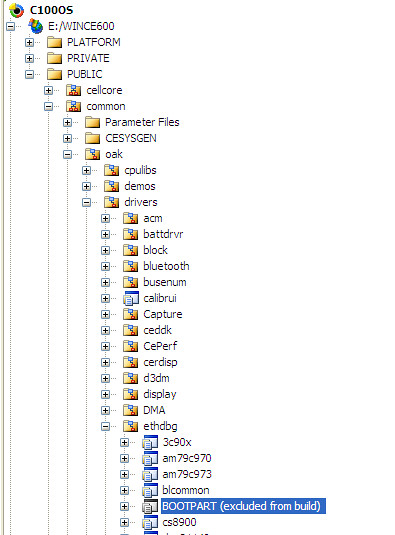
A majority of windows CE core and drivers code is available to us, they reside in public directory of CE installation folder. Occasionally, we may want to modify that part of code, either to change some system behaviors, or add some log messages for debugging our platform's code.
It's strongly recommended not to change the original code in place. Because this part of code is shared by all platforms. All platforms will be affected by the modification. The right way is before making any change, copy the module into our own platform directory, and modify the copy there.
Let's say we want to modify public/common/oak/bootpart module's code.
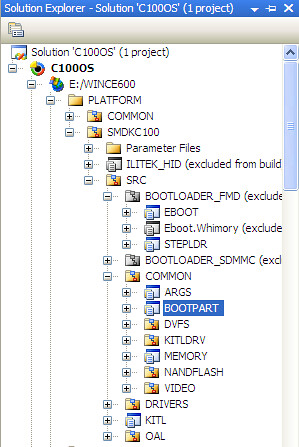
1. We first copy it into platform/platform_name/src/common/bootpart
2. Exclude public/common/oak/bootpart from our build

3. Include  platform/platform_name/src/common/bootpart into our build

4. The last step is to update other modules' sources file. For any module that depends our modified bootpart module, we should change its sources file so that it can find the new bootpart instead of the original bootpart shipped with CE. For instance, change $(_COMMONOAKROOT)\lib\$(_CPUINDPATH)\bootpart.lib to $(_TARGETPLATROOT)\lib\$(_CPUINDPATH)\bootpart.lib     

Monday, June 27, 2011

addr2line for windows

While debugging os or application crash bug on windows ce (the tool winaddr2line isn't particularly used for windows CE application, it can be used for normal windows application too.) platform, developers may not always have the luxury to debug step by step within a IDE. Most of time, the only information available to us is the output on serial port. (It's already very fortunate if we can see serial port output every time a crash happens.) What we get is something like:
Exception 'Data Abort' (4): Thread-Id=06890fba(pth=88eb8948), Proc-Id=06750f9e(pprc=88eb8828) 'test.exe', VM-active=06750f9e(pprc=88eb8828) 'test.exe'
PC=00011048(test.exe+0x00001048) RA=00011018(test.exe+0x00001018) SP=0002fb98, BVA=00000000


Unhandled exception c0000005:
Terminating thread 88eb8948

Given the PC register value, we need to figure out on while line in our code did the application crash. winaddr2line makes it an easy task as long as we have the pdb symbol file for the application. It's a attempt to port addr2line to windows world.
Let's take the preceding log for example. In order to find out the line number of the code that incurs the crash, we need following information.
  1. In which module did the crash happen
  2. What's the address can we use to query
For question 1, the module name is already available in the log. In our example, it's test.exe. For question 2, we can see the PC register's value is 0x00011048. So, we run "winaddr2line.exe -e test.exe 11048 -a -p -s -f" command, and get this: "0x00011048: foo::crash at test.cpp:8". Now we open test.cpp and check what's around line 8, the root cause is very obvious.

 1
 2 class foo
 3 {
 4     public:
 5         void crash()
 6         {
 7             int *a = NULL;
 8             int b = *a;
         }
10 };
11
12 int main ( int argc, char *argv[] )
13 {
14     foo f;
15     f.crash();
16     return 0;
17 }       

In order for the preceding command to work correctly, we must make sure the test.exe and its symbol file test.pdb is available in current directory of the shell that we run winaddr2line. If it's not the case, we should pass correct path to test.exe for -e argument and path to directory containing test.pdb for -y argument respectively.

In the example, we use PC register's value directly to query line number. But it's not always the case. Consider the crash log below:
Exception 'Raised Exception' (-1): Thread-Id=06891422(pth=88eb8948), Proc-Id=0675143e(pprc=88eb8828) 'test.exe', VM-active=0675143e(pprc=88eb8828) 'test.exe'
PC=4006d270(coredll.dll+0x0005d270) RA=80118a60(kernel.dll+0x00007a60) SP=0002fb8c, BVA=00000000


Unhandled exception c0000094:
Terminating thread 88eb8948

The crash occurred in coredll.dll module. We run command "winaddr2line.exe -e coredll.dll 4006d270 -a -p -s -f", but we can see it fails to find the line number. This is because we can't use the PC register's value directly here. The coredll.dll is loaded at 0x40010000 (0x4006d270-0x0005d270), which is different from its preferred ImageBase address (0x10000000, which can be examined with "dumpbin /headers coredll.dll" command). And winaddr2line can only make use of the ImageBase address contained statically in PE header of the binary. So, we must change the address to 0x1005d270 (0x10000000+0x0005d270). By using this address, we can see the crash occured at: d:\dublin2-1\private\winceos\coreos\core\dll\crtsupp.cpp:240

Source code for winaddr2line:
http://code.google.com/p/winaddr2line/

Tuesday, May 31, 2011

quickswitch

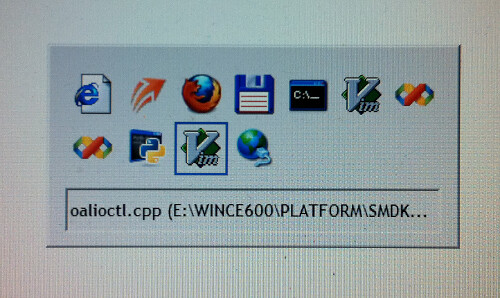
One of the most used function on a pc is switching between tasks. We may write some code in vim, switch to firefox to search for the usage of an api. And then switch back to vim continue writing code. Most of time, we do this by using Alt+Tab key combination. But it's not an efficient way if there are many tasks running. It's not quick enough to find the target task.

The main drawback with Alt+Tab is it forces us to deal with more problems. For example, we want to switch to firefox task, the essential problem we're dealing with is finding the task using the clue "FIREFOX". After we press Alt+Tab, we get a window list in which all tasks are identified by icons. Now, we have to deal with another problem, finding out the icon that represents firefox. That's to say, our brain has to do a "context switch" from the "word processing" problem to an "image recognition" problem.

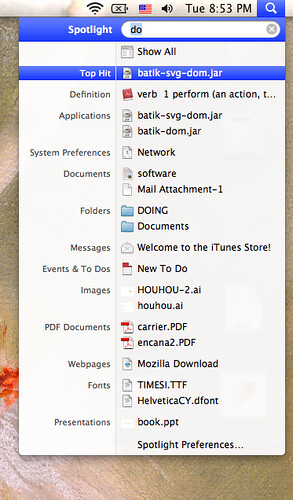
It's not intuitive at all. The idea of QuickSwitch is very similar to Spotlight on mac and FuzzyFinder on vim. We can keep concentrating on the "word processing" problem, no context switch.

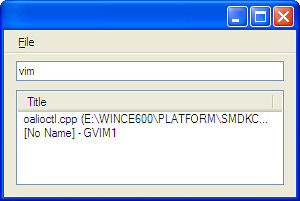
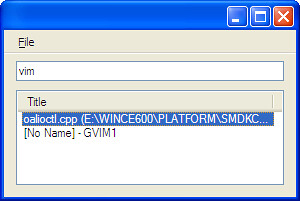
QuickSwitch runs as a daemon. By using it, at any time we want to switch ao another task, press Ctrl+Alt+S key combination to bring up the QuickSwith main window, in which all tasks are listed. Then, type any part of the window title of the desired task and press enter to switch to it.

For instance, if we want to switch to firefox task. Type "firefox" in the input box. As we type, the window list is filtered. Those windows don't contain the word we typed in title are filtered out. When there is only one result left in the list, we can press enter key once to switch to it. If there are more than one one result left, we can continuing typing more characters to filter out more un-desired tasks. Or we can press enter to bring focus to the result list and use up, down keys (or Ctrl+P, Ctrl+N) to select desired task and press enter again to switch to it.

Source code:
http://code.google.com/p/quickswitch/

Thursday, April 14, 2011

extend windows ce platform with oalioctl

Though not being a open source platform, windows ce is designed to be flexible so that device venders can extend it easily. oalioctl is a feature that makes it possible to do things in kernel space on behalf of application.

Features
1. Extensibility
The essential feature of oalioctl is it enables us to extend windows ce kernel's functions, and new functions are directly accessible to application layer developers.
2. Separation
oalioctl is completely separated from kernel source code. From the sense of code organization, it doesn't differ from a normal device driver. The separation makes it easy to maintain and port oalioctl module.
3. Easy to use

Compared to a normal ce driver, the usage of oalioctl is easier from an application developer's perspective. In order to make use of a normal driver, application usually follows below sequence:
CreateFile -> DeviceIoControl -> CloseHandle
But the application can simply call KernelIoControl to make use of oalioctl library, which is a far more easy way.

Implementation
oalioctl is implemented as a standalone dynamic library. And it will be loaded automatically during kernel initialization (relevant code is in LoaderInit() function in X:\WINCE600\PRIVATE\WINCEOS\COREOS\NK\KERNEL\loader.c). So it's not necessary to register this module in platform.reg as other stream drivers do.
When an application calls KernelIoControl, the call stack goes like this:
IOControl //our own oalioctl.cpp
OEMIOControl  // platform/common/src/common/ioctl/ioctl.c
IOControl // public/common/oak/oalioctl/oalioctl.cpp
EXTKernelIoCtl // private/winceos/coreos/nk/kernel/kwin32.c

How to implement our own oalioctl
It's a fair simple task to implement oalioctl layer for our own platform with following steps:
  1. copy public/common/oak/oalioctl directory to platform/platform_name/src/drivers
  2. change TARGETTYPE to DYNLINK in sources file
  3. define our own iocontrol code with CTL_CODE macro
  4. add a case branch for the new iocontrol code

Tuesday, March 8, 2011

resolve windows ce remote tool connection issue

remote tools for windows ce is a set of powerful tools for debugging. I have Visual Studio 2005, Windows Embedded CE 6.0 R3 installed, but the remote tools don't work. They fail to connect to device with following error message:
The Microsoft ActiveSync reported the following error: Unable to load device side components. Please check server configuration settings.

There are two ways to resolve the connection issue.

1. Run remote tools from windows start menu (e.g., Microsoft Visual Studio 2005\Visual Studio Remote Tools\Remote Process Viewer, which is a shortcut to C:\Program Files\CE Remote Tools\5.01\bin\ccpview.exe), instead of starting from visual studio menu (e.g., Target/Remote Tools/Process Viewer, which is a shortcut to C:\Program Files\Common Files\Microsoft Shared\Windows CE Tools\Platman\bin\wce600\cepview.exe). remote tools version 5.01 work fine.

2. Copy
c:\Program Files\Common Files\Microsoft Shared\Windows CE Tools\Platman\target\wce600\armV4i\
to
c:\Program Files\Common Files\Microsoft Shared\Windows CE Tools\Platman\target\wce600\armV4\
. The lack of the second directory is a bug in remote tools version 6 that causes the connection issue.

Tuesday, January 25, 2011

view call stack of crashed application on android

On android, when a process crashes in native code, the call stack of the process will be saved to a log file in /data/tombstomes/, and written to logcat as well. The information is helpful for debugging.
Unfortunately, the call stack doesn't show in human readable format, file name, function name. Instead, it's shown as module name (e.g., libc.so) and memory address of the instruction. We can use addr2line to translate the address to corresponding file name and function name if we have the binary of the module that contains symbol information.
To make it easier to use, this function is included in agdb tool (see here for more). We can use "agdb.py -r -e module_name address" to find out the function name of specified address within the module.

When we have a long call stack, instead of running the command above for each line in the call stack manually, we can feed the whole call stack to agdb through pipe and get the full resolved call stack. For example, use  "adb logcat | agdb.py -r" command for adb logcat output with below contents:

22 F/ASessionDescription(   33): frameworks/base/media/libstagefright/rtsp/ASessionDescription.cpp:264 CHECK_GT( end,s) failed:  vs.
23 I/DEBUG   (   30): *** *** *** *** *** *** *** *** *** *** *** *** *** *** *** ***
24 I/DEBUG   (   30): Build fingerprint: 'generic/generic/generic:2.3.1/GINGERBREAD/eng.raymond.20101222.130550:eng/test-keys'
25 I/DEBUG   (   30): pid: 33, tid: 450  >>> /system/bin/mediaserver <<<
26 I/DEBUG   (   30): signal 11 (SIGSEGV), code 1 (SEGV_MAPERR), fault addr deadbaad
27 I/DEBUG   (   30):  r0 deadbaad  r1 0000000c  r2 00000027  r3 00000000
28 I/DEBUG   (   30):  r4 00000080  r5 afd46668  r6 40806c10  r7 00000000
29 I/DEBUG   (   30):  r8 8031db1d  r9 0000fae0  10 00100000  fp 00000001
30 I/DEBUG   (   30):  ip ffffffff  sp 40806778  lr afd19375  pc afd15ef0  cpsr 00000030
31 I/DEBUG   (   30):          #00  pc 00015ef0  /system/lib/libc.so
32 I/DEBUG   (   30):          #01  pc 00001440  /system/lib/liblog.so
33 I/DEBUG   (   30):
34 I/DEBUG   (   30): code around pc:
35 I/DEBUG   (   30): afd15ed0 68241c23 d1fb2c00 68dae027 d0042a00
36 I/DEBUG   (   30): afd15ee0 20014d18 6028447d 48174790 24802227
37 I/DEBUG   (   30): afd15ef0 f7f57002 2106eb56 ec92f7f6 0563aa01
38 I/DEBUG   (   30): afd15f00 60932100 91016051 1c112006 e818f7f6
39 I/DEBUG   (   30): afd15f10 2200a905 f7f62002 f7f5e824 2106eb42
40 I/DEBUG   (   30):
41 I/DEBUG   (   30): code around lr:
42 I/DEBUG   (   30): afd19354 b0834a0d 589c447b 26009001 686768a5
43 I/DEBUG   (   30): afd19364 220ce008 2b005eab 1c28d003 47889901
44 I/DEBUG   (   30): afd19374 35544306 d5f43f01 2c006824 b003d1ee
45 I/DEBUG   (   30): afd19384 bdf01c30 000281a8 ffffff88 1c0fb5f0
46 I/DEBUG   (   30): afd19394 43551c3d a904b087 1c16ac01 604d9004
47 I/DEBUG   (   30):
48 I/DEBUG   (   30): stack:
49 ........................
92 I/DEBUG   (   30):     408067e4  6f697470
93 I/BootReceiver(   75): Copying /data/tombstones/tombstone_09 to DropBox (SYSTEM_TOMBSTONE)

we get:


22 F/ASessionDescription(   33): frameworks/base/media/libstagefright/rtsp/ASessionDescription.cpp:264 CHECK_GT( end,s) failed:  vs.
23 I/DEBUG   (   30): *** *** *** *** *** *** *** *** *** *** *** *** *** *** *** ***
24 I/DEBUG   (   30): Build fingerprint: 'generic/generic/generic:2.3.1/GINGERBREAD/eng.raymond.20101222.130550:eng/test-keys'
25 I/DEBUG   (   30): pid: 33, tid: 450  >>> /system/bin/mediaserver <<<
26 I/DEBUG   (   30): signal 11 (SIGSEGV), code 1 (SEGV_MAPERR), fault addr deadbaad
27 I/DEBUG   (   30):  r0 deadbaad  r1 0000000c  r2 00000027  r3 00000000
28 I/DEBUG   (   30):  r4 00000080  r5 afd46668  r6 40806c10  r7 00000000
29 I/DEBUG   (   30):  r8 8031db1d  r9 0000fae0  10 00100000  fp 00000001
30 I/DEBUG   (   30):  ip ffffffff  sp 40806778  lr afd19375  pc afd15ef0  cpsr 00000030
31 I/DEBUG   (   30):          #00  pc 00015ef0  /system/lib/libc.so
32 I/DEBUG   (   30):          #00  __libc_android_abort: abort.c:82
33 I/DEBUG   (   30):          #01  pc 00001440  /system/lib/liblog.so
34 I/DEBUG   (   30):          #01  __android_log_assert: logd_write.c:235
35 I/DEBUG   (   30):
36 I/DEBUG   (   30): code around pc:
37 I/DEBUG   (   30): afd15ed0 68241c23 d1fb2c00 68dae027 d0042a00
38 I/DEBUG   (   30): afd15ee0 20014d18 6028447d 48174790 24802227
39 I/DEBUG   (   30): afd15ef0 f7f57002 2106eb56 ec92f7f6 0563aa01

Similarly, we copy a tombstone file to our development pc, and use "cat tombstone_01.txt | agdb.py -r" command to resolve call stack addresses in the tombstone log file.

Wednesday, January 19, 2011

install h.264 plugin for linphone on ubuntu

h.264 plugin isn't a standard part of linphone installation on ubuntu. We must manually compile and install it.

1. Download msx264 plugin source code.
2. Run sudo apt-get install libmediastreamer-dev libx264-dev libavcodec-dev libswscale-dev libtheora-dev to meet msx264's dependency requirements.
3. Run ./configure --prefix=/usr/lib. It's mandatory to set prefix to /usr/lib, because linphone can't find the plugin if it's installed in default location, /usr/local/lib.
4. Run sudo make install.
5. Change the line 393 in src/msx264.c from


393     if (sws_scale(s->sws_ctx,(uint8_t * const*)orig->data,orig->linesize, 0,

to


393     if (sws_scale(s->sws_ctx,(uint8_t **)orig->data,orig->linesize, 0,

to get rid of compilation error, if you have.

6. Restart linphone, the h.264 plugin should be available now.

Thursday, January 13, 2011

utility for debugging android native application

agdb is a utility aims to ease the task of debugging android native application. Its working mechanism is similar to ndk-gdb. But it's intended to assist debugging native applications in android source tree, not for application created with ndk.

It does following things for us automatically:
  1. find the binary that contains symbol data of target process
  2. attach gdbserver to the target process on device, or start the target process under gdbserver if the process isn't already running
  3. start gdb client and set correct symbol file search path
How to use it
  prerequirements
agdb must know the root directory of android source code. We can tell it by passing --android-src-root argument or setting ANDROID_SRC_ROOT environment variable.
agdb interacts with target device through adb, so the device must be accessible through adb.
gdb client communicates gdbserver through tcp protocol (tcp port 7890 by default). If using emulator, we need to forward or redir tcp ports in advance.

 usage
After all prequirements are met, we can run "agdb.py process_name" to debug desired application. For example, if we want to debug mediaserver application, simply run agdb.py mediaserver.
If we want to debug code in native part of a dalvik (java) application, we can use:
agdb.py --dalvik [package_name (for example, com.android.launcher)]


Limitation
It doesn't work on Windows.
It starts gdbserver in network communication mode, serial port isn't supported.
It doesn't support dalvik application.

Reference
http://source.android.com/porting/debugging_gdb.html

Monday, January 10, 2011

view raw yuv file with mplayer

mplayer is a powerful utility that is helpful for examining the raw yuv file.
We decoded this h.264 media file (test_avc_amr.mp4) coming with android opencore to yuv format, saved as a.yuv. The command below can display the yuv file frame by frame:
mplayer -demuxer rawvideo -rawvideo w=176:h=144:format=i420 a.yuv -loop 0

The internal structure of a.yuv is a serial of yuv frames, without any header describing the size and format.

So, to make mplayer work, we should tell it the width and height of the yuv in pixel. Also, we need to specify the format of the raw video. The command below shows us all available formats:
mplayer -rawvideo format=help

References:
mplayer manual page
mplayer online documentation